Gas Chromatographic Analysis of Plant Sterols
The Author: Jill Winkler-Moser, USDA, ARS, NCAUR, Functional Foods Research Unit, 1815 N University Street, Peoria, IL 61611, U.S.A. DOI:10.21748/lipidlibrary.40384
Introduction
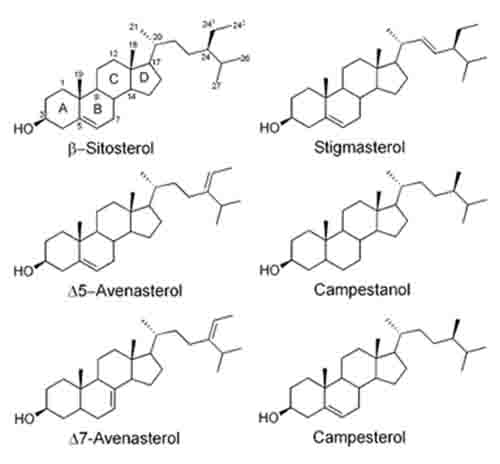
Plant sterols (phytosterols) are ubiquitous in plants, and can be classified either as 4-desmethylsterols, 4-methylsterols, or 4,4’-dimethylsterols. The phytosterols found in the highest abundance in most plants are sitosterol, campesterol, and stigmasterol, which are all classified as 4-desmethylsterols (Fig. 1). However, there are reportedly over 200 different sterol structures that have been discovered in various plant species [1]. Plant sterols can exist in plants in their free form, as esters with fatty acids, ferulic acid, or p-coumaric acid, or as glycosides and acylated steryl glycosides. The most common phytosterols have a double bond at position 5 of the B-ring, (commonly referred to as Δ5), however, Δ7-phytosterols are also found in many seed oils, while cereals such as corn, wheat, rice, rye, and triticale also contain appreciable amounts of saturated sterols, or phytostanols, such as sitostanol and campestanol [2-4].
Figure 1. Structures of some common phytosterols and phytostanols
Phytosterols are well-known for their ability to lower blood cholesterol by competing with absorption of cholesterol from the diet and reabsorption of bile cholesterol [5]. Phytosterols as food ingredients are “Generally Recognized As Safe” (GRAS) by the FDA, and they are increasingly incorporated into various products as functional food ingredients. In the year 2000, the FDA approved a health claim relating phytosterol ester or phytostanol ester consumption to reduced risk for coronary heart disease, in foods such as margarines and spreads, salad dressings, snack bars, and dietary supplements [6]. However, the FDA has recently proposed to extend the health claim to include free phytosterols and an increased number of conventional foods [7]. The European Union (EU) has also approved similar health claims, and has established labeling guidelines for these foods [8]. Labeling requirements by both the FDA and the EU include a declaration of the content of plant sterols or sterol esters, and include specifications for phytosterol or phytostanol composition of the esters. Thus, there is increased interest in qualitative and quantitative analysis of phytosterols in food products.
Gas chromatography (GC) is the most common method for analyzing phytosterol content and composition [9]. There are HPLC methods available for separating and quantifying the various forms of phytosterols, such as free sterols, steryl fatty acid esters, steryl glycosides, acylated steryl glycosides, and hydroxycinnamic acid esters of sterols [1,10]. However, with over 200 different structures, GC, often combined with mass spectrometry, is the best and most widely used tool for the chromatographic separation, identification, and quantification of phytosterols. There are several standardized methods for phytosterol analysis that are approved by organizations such as the German government [11], the Association of Official Analytical Chemists (AOAC) [12], American Oil Chemists’ Society (AOCS) [13], and the International Organization for Standardization (ISO) [14]. Most standardized methods are somewhat tedious in terms of the amount of glassware, sample, and solvent required and in the number of steps in the procedure, which make it difficult to analyze multiple samples at the same time. These procedures have been modified by users to require smaller sample sizes, less solvent, and to eliminate some of the time-consuming cleanup steps [15]. However, for the most part, the latest techniques employ the same basic steps that the traditional methods use: (1) Sample preparation (sample weighing, lipid extraction (optional), addition of internal standard, acid and/or alkaline hydrolysis, extraction of unsaponifiables, optional sample cleanup/further purification, (2) derivatization, and (3) GC analysis. The intent of this chapter is to describe these steps in both an informative and practical manner.
2. Sample Preparation
The first and most important step in the analysis of phytosterols is sample preparation. Since phytosterols are a minor component that typically comprises less than 1% of the matrix (but up to 8% in food products with added phytosterols), the goals of sample preparation are to isolate the sterol fraction and to convert all conjugated or esterified phytosterols into free phytosterols for GC analysis. The type of sample preparation needed depends on the sample matrix (whole plant tissue or extracts, food product, supplement, vegetable oil, blood serum, etc.) and also on the original form of the phytosterol in the sample. In some samples, such as blood serum, where phytosterols are present in very low concentrations, lipid extraction to concentrate the phytosterol-containing lipid fraction away from proteins and other compounds may be a necessary first step [16]. In other cases, the analyst may want to quantify other lipids in the sample, or the various forms of phytosterols, i.e. phytosterol ferulates, phytosterol esters, free phytosterols, so a total lipid extract will also be needed. However, for many matrices, direct alkaline or acid hydrolysis has been used successfully [15,17]. If free sterols and sterol esters are the only sterol forms anticipated in the sample, such as in a refined oil or fat sample, then alkaline hydrolysis (saponification), followed by extraction of the unsaponifiable material, is sufficient sample preparation for analysis of total phytosterols. However, in samples such as cereal products, the phytosterols may be trapped within the carbohydrate matrix, or may have bonds that are not hydrolyzed by saponification, such as the glycosidic bonds in steryl glycosides. In this case, acid hydrolysis prior to saponification is necessary [17].
2a. Sample Amount
The sample amount is dependent on the concentration of phytosterols in the sample, the ability to completely hydrolyze the sample and liberate all of the phytosterols, and the quantification limits of the GC. Therefore, sample weight needs to be optimized for each product. An estimate of the phytosterol concentration in a sample can usually be determined based on a survey of the literature for the same or similar sample types. Samples containing at least 50-150 µg of a mixture of phytosterols can easily be analyzed [18]. Laakso [15] suggests a sample size containing 1 mg phytosterols, but that method is targeted for foods that are supplemented with high concentrations of phytosterols. Phillips et al. [16] reported limits of quantification for individual phytosterols in serum samples ranging from 0.2-1.2 µg/mL, corresponding to injected concentrations that ranged from 1.8-10.8 µg/Ll (1.8-10.8 ng/1 µL injection).
2b. Internal Standard
For phytosterol analysis, the addition of an internal standard (IS) is necessary to obtain accurate qualitative and quantitative results by GC. Since retention times often shift from run to run, the main function of the IS is to aid in the identification of phytosterols in unknown samples, based on the relative retention time (RRT) of the phytosterol compared to the internal standard. In addition, when using a split injection, which is typically the case in phytosterol analysis, the amount of sample entering the column will vary slightly from injection to injection, so the IS is used to compensate for this variation. Finally, large variations in peak response (area) for the IS is a good indicator that there is a problem with the extraction protocol or with the GC injection.
The IS should be a compound that is commercially available in pure form, and that is similar in structure to phytosterols so that it will be extracted quantitatively with the sample phytosterols, and elute from the GC column within the time frame and with a similar detector response to other phytosterols, without interfering with the retention time of sample peaks. The IS is typically added to the sample prior to alkaline or acidic hydrolysis, so that it undergoes the same extraction conditions as the sample phytosterols. However, the IS may also be added after extraction but prior to derivatization.
The most common internal standards for phytosterol quantification are 5α-cholestane [18], dihydrocholesterol (5α-cholestan-3β-ol) [19], epicoprostanol (5β-cholestan-3α-ol) [15], and betulin (Lup-20(29)-ene-3β,28-diol) [11] (Fig. 2).
Figure 2. Structure of sterols and other compounds commonly used as internal standards.
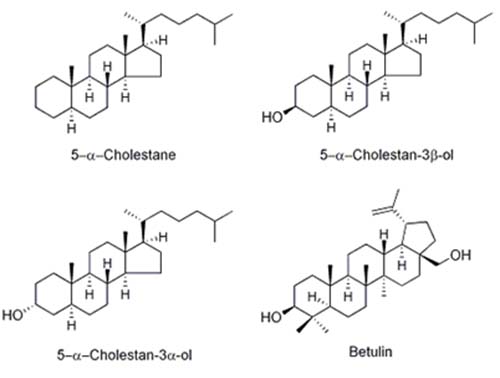
Epicholesterol (5α-cholesten-3β-ol) has also been used as an IS [16]. 5α-Cholestane does not have a hydroxyl group, so it cannot be silylated. The advantage of using 5α-cholestane as a standard is that it elutes early so there is little chance of interference with other sterols, and the detector response is very similar to most phytosterols. However, if there is a problem with the silylation reaction where samples are incompletely silylated, cholestane will not be affected and therefore will not serve as an indicator of the problem. Betulin (Lup-20(29)-ene-3β,28-diol) is used by the standardized German method [11], but it has two hydroxyl groups, so it may require a longer time for complete silylation and it elutes much later than the other sterols, prolonging analysis times. Dihydrocholesterol is a good choice, but it is a hydrogenation product of cholesterol, so it could interfere with this peak in samples that contain cholesterol and have been subjected to hydrogenation. Epicoprostanol does not occur naturally in plants, elutes early, and thus does not usually interfere with phytosterol peaks [15].
2c. Acid Hydrolysis
If the sample has a complex protein or carbohydrate matrix and/or contains steryl glycosides, acidic hydrolysis is necessary to free the sterols from the glycosidic bond or from the surrounding matrix [15,17]. In this case, the IS is added to the weighed sample, the sample is hydrolyzed with hydrochloric acid (~3.5 M) with reflux at 100°C, followed by lipid extraction using a nonpolar solvent. After solvent removal by rotary evaporation, saponification of the lipid sample proceeds as described below.
2d. Saponification
Saponification without acid hydrolysis is sufficient sample preparation in refined oil/fat samples or lipid extracts, where the sterols primarily exist as free sterols or steryl esters. Sterol esters are hydrolyzed to free sterols, and the sterols are concentrated in the unsaponifiables fraction, while the triacylglycerols are converted to fatty acid salts. Under typical hydrolysis conditions, 1-2.5 N ethanolic or methanolic KOH is added directly to the oil sample plus IS (or to a lipid extract obtained after acid hydrolysis), and the reaction is heated at 60°C to 80°C, either in a capped test tube or in a round-bottom flask with a reflux condenser, for 1 hr or until completely saponified [11-19]. After saponification, water and/or saturated sodium chloride are added and the unsaponifiable material is extracted by mixing vigorously or vortexing with a nonpolar solvent such as hexane, heptanes, diethyl ether, chloroform, or mixtures thereof. When the phases separate (centrifugation facilitates phase separation), the fatty acid salts will partition to the polar phase while the unsaponifiables will remain in the nonpolar phase. The extraction of the polar phase with a nonpolar solvent is usually repeated at least once to maximize yield. Rigorous extractions include washing the nonpolar phase with water or saturated salt solutions, but most researchers have been able to omit these time- and solvent-consuming steps and still obtain quantitative yields. Nonpolar extracts are combined, and dried under a stream of nitrogen or by rotoevaporation, and redissolved in an appropriate amount of solvent for either cleanup by thin-layer chromatography (TLC) or solid-phase extraction (SPE), or directly for derivatization. As an alternative to liquid-liquid extraction of unsaponifiables, the German method [11] uses aluminium oxide columns to fractionate the unsaponifiables. The soap solution in ethanol is applied to 10 g alumina columns and simply eluted with diethyl ether. In another procedure, saponified oil absorbed to silica gel was layered onto a column containing a layer of sodium sulfate and a layer of silica, and the unsaponifiable material was eluted with a mixture of tert-butylmethyl ether and ethyl acetate (1:1, v/v) [20].
2e. Cleanup and Further Purification of Unsaponifiable Lipids
After saponification, the lipid extract, called “unsaponifiables”, may contain other lipids besides sterols including hydrocarbons, carotenoids, tocopherols, free fatty acids, and other triterpenes. Many researchers proceed with derivatization and GC analysis without further sample cleanup and do not have problems with interference by these compounds. This is usually acceptable for the unsaponifiables fraction of a refined fat or oil sample. However, in some samples, such as crude oils, it may be necessary to further purify the sterol fraction from polar unsaponifiable lipids. Silica, C18, and aminopropyl SPE cartridges have all been used for this purpose. Phillips and co-workers [16] used aminopropyl SPE columns to separate sterols and stanols from serum unsaponifiable lipids, using chloroform: isopropanol for elution. Toivo and co-workers [17] demonstrated that equal yields were obtained using either C18 or silica SPE columns and eluting the sterol fraction from either column with 5% methanol in chloroform or 1% isopropanol in hexane, respectively.
Separation of 4-desmethylsterols, 4-methylsterols, and 4,4’-dimethylsterols. The 4,4’-dimethylsterols and 4-methylsterols are biosynthetic precursors to 4-desmethylsterols, and thus are usually present at lower levels in mature plant tissues. However, some oils such as linseed and olive, have relatively high content of 4,4-dimethylsterols [21]. Some of these compounds co-elute on GC columns with 4-desmethylsterols, necessitating separation of the three fractions. Column chromatography or TLC was used to isolate the three phytosterol classes prior to the invention of disposable SPE columns. For example, neutral alumina columns (30 g) were used to chromatograph 1 g unsaponifiable fractions into 4,4’-dimethylsterols, 4-methylsterols, and 4-desmethylsterols by sequential elution with 80:20 (v/v), 70:30, and 60:40 mixtures of hexane/diethyl ether [22]. The three phytosterol classes can also be separated into three different zones on a silica TLC plate by developing twice in hexane/diethyl ether/acetic acid (70:30:1, v/v) [21] or by one development on with a 1:1 (v/v) mixture of hexane:diethyl ether [11].
Column chromatography can take time to set up so is not very amenable to running multiple samples. TLC is quicker and easier to run, but yields can often be low. Therefore, Azadmard-Damirchi and Dutta [23] and Azadmard et al. [24] developed a method for separation of the three phytosterol classes using disposable silica SPE columns and sequential elution with hexane:diethyl ether mixtures of increasing polarity. This method resulted in much higher recovery compared to traditional TLC.
Separation of Δ5-phytosterols from Δ7-phytosterols. Separation of Δ5-sterols from Δ7-sterols can be difficult when they are both present in significant quantities [20]. Zhang and coworkers [25] developed a silica gel column chromatography method to sequentially elute Δ7-4-methylsterols, Δ5-4-desmethylsterols, and Δ7-4-desmethylsterols. This method could likely be adapted for use with SPE columns.
2f. Derivatization
Sterols are usually analyzed as either trimethylsilyl (TMS) ethers or as sterol acetates, which improves their volatility, peak shape, and response factors. Injection of free sterols results in broader peaks and a lower FID response. Acetylation with acetic anhydride was common in the past, but silylation is the more common derivatization method these days. One silylation reagent used is N,O-bis(trimethylsilyl)trifluoroacetamide (BSTFA), often with added 1% trimethylchlorosilane, which acts as a catalyst to improve the reactivity of hindered hydroxyl groups. N-Methyltrimethylsilyltrifluoroacetamide (MSTFA) is also used, as well as mixtures of hexamethyldisilazane (HMDS) with TMCS (Tri-Sil HTP™, Thermo-Fisher Scientific, or Hydrox-Sil™, Regis, Morton Grove, IL). Note that while there are several different Tri-Sil mixtures available with differing compositions (Tri-Sil HTP is HMDS:TMCS:pyridine, Tri-Sil BP is N,O-bis(trimethylsilyl)acetamide (BSA):pyridine, Tri-Sil TBT is trimethylsilylimidazole (TMSI):BSA:TMCS, and Tri-Sil TP is TMSI:pyridine), in the literature the reagent is often referred to as 'Tri-Sil', without specifying which variation was used.
A basic silylation procedure using BSTFA:TMCS is to mix <1 to 5 mg purified phytosterols or unsaponifiable material, with 0.2 mL of a 1:1 mixture of pyridine and BSTFA+1%TMCS (or other silylation reagent) in a capped tube or vial. The reaction can be heated to 60°C to 70°C for anywhere up to an hour. We have found optimal conditions to be 60°C for 1 hr [18]. However, with silylation mixtures containing HMDS with TMCS, such as Tri-Sil HTP™ and Hydrox-Sil™, derivatization reactions may proceed completely in five to fifteen minutes at room temperature, according to the product brochures. However, if the hydroxyl groups on the sterols are hindered in any way, the mixture may need to be heated to complete the reaction. We have found, anecdotally, that some sterols such as ergosterol and 4,4-dimethylsterols seem to take longer to completely derivatize than others. If silylation is not complete, two peaks will elute in the chromatogram, rather than one. Since silylation reagents are available in several forms and from various manufacturers, it is important to optimize the silylation conditions according to the manufacturer's instructions, the sterols being analyzed, and the conditions of each individual laboratory.
3. GC Analysis
Once derivatized, phytosterols can immediately be analyzed by GC, or diluted in an organic solvent to an appropriate concentration and then injected. The TMS-ethers are known to hydrolyze over time, so they should be analyzed within a few days. Although the derivatization reagents elute early and do not interfere with peaks of interest, we have found that they quickly foul and eventually plug GC injector split inserts. This can be prevented by carefully evaporating the derivatization reagents with nitrogen at low temperatures to prevent any phytosterol ethers from evaporating as well, then redissolving the phytosterols in chloroform before injecting. This is a tedious extra step, but it can prevent instrument downtime and data loss.
3a. Column Phase
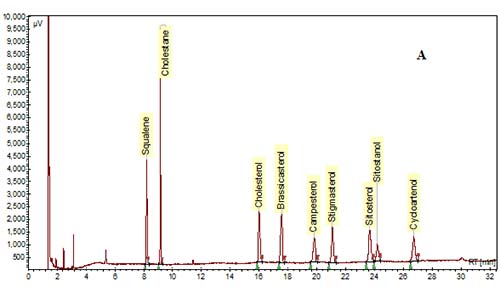
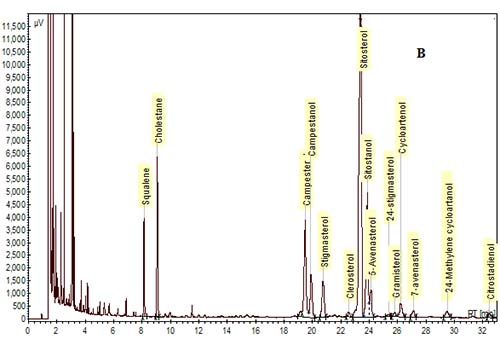
In the past, packed glass GC columns were used for phytosterol analysis, but this column technology has been replaced with fused-silica capillary columns due to improvements in resolution and sensitivity. Various column phases have been used to analyze phytosterols as reviewed by Abidi [10]. In general, most labs utilize polysiloxane phases of low- to mid-polarity. The most common column phase used for general phytosterol analysis is composed of 95% dimethyl-, 5% diphenyl-polysiloxane, which is available from a number of manufacturers (RTX-5/Restek, DB-5/J&W, SPB-5 or PTE-5/Supelco, HP-5/Agilent). A slightly more nonpolar phase of 100% dimethyl polysiloxane (RTX-1, DB-1, SPB-1, HP-1, etc.) can be used, but separation of a sterol peak from its respective stanol peak is not easily achieved with this column phase. A mid-polarity column may be useful to achieve better resolution of sterols and stanols, or of Δ5-sterols from Δ7-sterols. For example, a mid-polarity DB-1701 (14% cyanopropyl-phenyl-methylpolysiloxane) was suggested by Dutta and Normén [26] for better resolution of Δ5-saturated and unsaturated sterols. We and others have found that baseline separation of sterol/stanol peaks can be achieved with a 95% dimethyl, 5% diphenyl-polysiloxane column, but sitosterol and Δ5-avenasterol overlap to some extent [15,30] (Fig. 3). A higher-polarity column may be necessary for the samples that are high in Δ7-sterols. For example, a fused-silica capillary column with a 65% dimethyl-35% diphenyl polysiloxane phase (DB-35) was used to analyze phytosterols in pumpkin seed oil, which are mainly composed of Δ7-sterols [20,27].
Figure 3. GC chromatograms of TMS-ether derivatives of phytosterols on a DB-5 capillary column (30 m × 0.25 mm i.d. × 0.25 µm). (A) A mixture of standards. (B) Phytosterols in oil extracted from corn distillers dried grains. Cholestane was the IS. GC conditions are described in [30].
3b. Chromatography Conditions
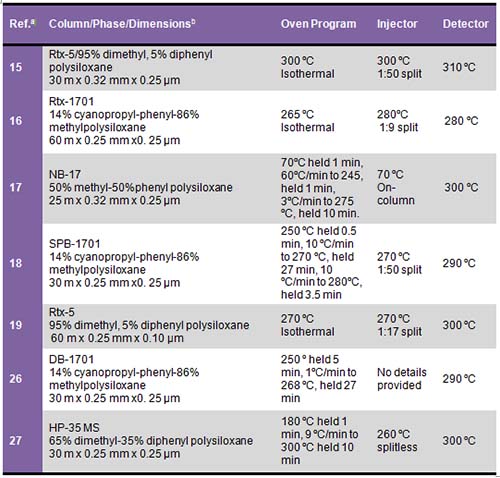
Every analyst will likely need to optimize GC conditions depending on his or her analytical needs, equipment, and sample type. In general, a typical phytosterol chromatography method will include a split injection (with split ratios varying from 1:15 to 1:100), injector temperature from 250°C-300°C, initial column temperature, 250-300°C, and either isocratic or temperature-programmed oven heating, and flame ionization detection (FID) with the detector temperature set to 280°C-325°C (Table 1).
Table 1. Column and GC conditions used for phytosterol analysis
a Reference number
b Column dimensions are length × inner diameter × column phase thickness
3c. Elution Order
The elution order is influenced by many structural features such as the number of carbons on the side chain, the degree of saturation and location of double bonds in the rings and/or in the side chain, their orientation (cis vs. trans), and the number of methyl groups at the 4-position [10,28,29]. For example, in general, phytosterols with an ethyl group at the 24-position in the side chain will have longer retention times than those with a methyl group, and phytosterols with a double bond at the 5-position elute before the saturated counterpart, and before the counterpart with a double bond at the 7-position. In addition, sterols with a double bond at the 22-position elute earlier than sterols with no double bonds in the side chain. The elution order for some of the most common 4-desmethylsterols is: cholesterol < brassicasterol < campesterol < campestanol < stigmasterol < sitosterol < sitostanol < Δ5-avenasterol (Fig. 3).
3d. Identification
Phytosterol peaks are identified using flame-ionization detection (FID) by comparing the retention times (RT) of sterol peaks to those of pure standards. A few sterol standards including cholesterol and cholesterol derivatives and analogues, campesterol, campestanol, stigmasterol, sitosterol, sitostanol, brassicasterol, fucosterol, cycloartenol, and ergosterol are available from commercial vendors such as Sigma, Steraloids, Matreya, Research Plus, and Avanti Polar Lipids, to name a few. Most of the less common phytosterols are not commercially available. In the absence of pure standards, identification of unknown phytosterol peaks in a sample can sometimes be a puzzle. However, using a variety of techniques, analysts can usually piece together enough information to identify unknown peaks with some confidence. First, the elution characteristics and relative retention times (RRT) can be used to give clues about the structural features and identity of unknown peaks [28]. RRT for many phytosterols are found in the literature, but differences in the internal standard used, GC conditions, and form of phytosterol (free, TMS-ether, or acetate) may complicate using this data alone to identify an unknown peak.
Therefore, GC-mass spectrometry (GC-MS) is a valuable aid for identifying unknown phytosterol peaks [31,32] as well as for confirming the identification and purity of identified phytosterols. Electron impact (EI) ionization in the positive mode, usually with an ionizing voltage of 70 eV, is the most common ionization method used for GC-MS analysis of phytosterols. With free sterols and TMS-ethers of sterols, this technique usually gives the molecular ion as well as characteristic ion fragments that are useful for identification [31,32]. The mass spectra obtained are usually fairly consistent, so that comparisons can be made with data obtained in different laboratories.
3e. Methods of Quantification
Most modern GC control and analysis software packages have built-in capabilities to automatically integrate peaks, generate standard curves or response factors, and provide users with output that has already been integrated and calculated based on the standard curves or response factor. As mentioned above, quantification of phytosterols by GC is most accurate and reproducible when an internal standard is used in combination with generating a standard curve or response factors with pure standards. This requires obtaining standards and determining their purity by running them by themselves on the GC and determining the purity as the %peak area for all nonsolvent peaks, since sometimes the purity is different from the claim on the label. If a pure standard is not available, then response factors cannot be determined. To solve this problem, most researchers use the response factor (or standard curve) of the nearest peak with an available standard. However, the use of theoretical correction factors is also discussed below.
Equal Response Factors. Epicoprostanol, dihydrocholesterol, and 5α-cholestane have all been reported to have similar FID response to phytosterols, and therefore have been used without determining response factors (RF) or developing a standard curve for the individual phytosterols [15]. Their equal response may depend on the instrumental conditions of each lab, and should therefore be verified by plotting the ratio of peak areas for phytosterol standards to the IS on the y-axis vs the ratio of the phytosterol amount to the IS amount over the on the x-axis. The response of sample concentration vs. peak area should be linear, and the slope of the curve should be very near to 1.0. If the response factors are equal, then the amount or concentration for each phytosterol is calculated using the following formula:
where CP is the phytosterol amount or concentration, CIS is the internal standard amount or concentration, AP is the area of the phytosterol peak, and AIS is the area of the internal standard peak.
Standard Curve. If the response factors are not equal for IS and a standard, as we have found for a few phytosterols, especially campesterol, then a standard curve can be developed as described above, generating a line with the equation:
where m = the slope of the line (effectively the empirical response factor for the phytosterol) and b is the y-intercept. Thus the amount of phytosterol would be calculated as:
Note that when developing this type of standard curve, the IS amount or concentration is usually left the same, while the phytosterol standard concentration is added in varying amounts within the range expected in subsequent samples.
Single Point Response Factors. In lieu of developing a standard curve for each standard, one could determine a single point response factor (RF) at one concentration for each standard.
The calculated RF could then be used in the above equation to determine the amount of each phytosterol in a sample [16].
Theoretical Correction Factors. Theoretical correction factors (TCF) are based on the finding that the relative molar response of a compound detected by FID is proportional to the number of carbons in a hydrocarbon [33]. All non-carbonyl carbons in a compound’s structure are considered active carbons that contribute to the FID response. Costin and coworkers [34] tested the use of TCF for the quantitation of TMS-ether derivatives of stigmasterol, campesterol, and sitosterol using epicoprostanol as an internal standard. They determined that the TMS carbons contribute to the FID response, and thus should be included in the calculation of TCF. They also demonstrated that for all of the sterols that they tested, other than campesterol, the TCF were similar to the empirically determined response factors. This may have been affected by the fact that the purity of campesterol standards is often less than 90%. The TCF is calculated as [34]:
Then, the sterol TCF relative to the IS TCF is calculated as:
Thereafter, the amount of each phytosterol can be determined by:
The advantages of using TCF are that they are simpler and faster than developing standard curves for each phytosterol standard, and can be used for accurate quantification of phytosterols where there is no pure standard available, as long as the phytosterol is accurately identified. However, Costin and coworkers [34] also demonstrated that the GC injection type (split vs. cold-on-column) affected the precision of results, and thus cautioned that GC conditions should be optimized to improve results using TCF for quantification. TCF are used in the official AOCS method for the analysis of the fatty acid composition of vegetable oils [35], but they are still not utilized much for the analysis of phytosterols.
References
- Moreau, R.A., Whitaker, B.D. and Hicks, K.B. Phytosterols, phytostanols, and their conjugates in foods: structural diversity, quantitative analysis, and health-promoting uses. Prog. Lipid Res., 41, 457-500 (2002) (DOI: 10.1016/S0163-7827(02)00006-1).
- Seitz, L.M. Stanol and sterol esters of ferulic acid and p-coumaric acids in wheat, corn, rye, and triticale. J. Agric. Food Chem., 37, 662-667 (1989) (DOI: 10.1021/jf00087a019).
- Piironen, V., Toivo, J. and Lampi, A.-M. Plant sterols in cereals and cereal products. Cereal Chem., 79, 148-154 (2002) (DOI: 10.1094/CCHEM.2002.79.1.148).
- Jiang, Y. and Wang, T. Phytosterols in cereal by-products. J. Am. Oil Chem. Soc., 82, 439-444 (2005) (DOI: 10.1007/s11746-005-1090-5).
- Jones, P.J.H. Cholesterol-lowering action of plant sterols. Curr. Atheroscler. Rep., 1, 230-235 (1999).
- Code of Federal Regulations, Title 21 Part 101 Subpart E, 101.83 Health claims: plant sterol/stanol esters and risk of coronary heart disease (2000).
- Food and Drug Administration, Department of Health and Human Services, Food labeling; health claim; phytosterols and risk of coronary heart disease. Federal Register, 75 (235), 76536-76571 (2010).
- European Commission regulation (EC) 608/2004 of 31st March, 2004 concerning labeling of foods and food ingredients with added phytosterols, phytosteryl esters, phytostanols, and/or phytostanyl esters. Off. J. Eur. Comm., L97, 44-45 (2004).
- Heupel, R.C. Isolation and primary characterization of sterols. In: Analysis of Sterols and Other Biologically Significant Steroids. pp. 1-32 (W.D. Nes and E.J. Parish (eds), Academic Press, Inc, San Diego, CA) (1989).
- Abidi, S.L. Chromatographic analysis of plant sterols in foods and vegetable oils. J. Chromatogr. A, 935, 173-201 (2001) (DOI: 10.1016/S0021-9673(01)00946-3).
- Aitzetmüller, K., Brühl, L. and Fiebig, H.-J. Analysis of sterol content and composition in fats and oils by capillary-gas liquid chromatography using an internal standard. Comments on the German sterol method. Fett/Lipid, 100, 429-435 (1998).
- AOAC Official Method 994.10 Cholesterol in foods, and Approved Method 2007.03 Campesterol, stigmasterol, and beta-sitosterol in saw palmetto raw materials and dietary supplements. In: Official Methods of Analysis of AOAC International, 18th Edition (W. Horwitz and G. Latimer (eds), AOAC International, Gaithersburg, MD) (2010).
- AOCS Official Method Ch 6-91 Determination of the composition of the sterol fraction of animal and vegetable oils and fats by TLC and capillary GLC. In: Official Methods and Recommended Practices of the AOCS, 6th Edition, D. Firestone(ed.), AOCS, Urbana, IL (2009).
- International Organization for Standardization, ISO 12228:1999 Animal and vegetable fats and oils-determination of individual and total sterols content-gas chromatographic method. Geneva, Switzerland (1999).
- Laakso, P. Analysis of sterols from various food matrices. Eur. J. Lipid Sci. Technol., 107, 402-410 (2005) (DOI: 10.1002/ejlt.200501134).
- Phillips, K.M., Ruggio, D.M. and Bailey, J.A. Precise quantitative determination of phytosterols, stanols, and cholesterol metabolites in human serum by capillary gas-liquid chromatography. J. Chromatogr. B, 732, 17-29 (1999) (DOI: 10.1016/S0378-4347(99)00257-1).
- Toivo, J., Lampi, A.-M., Aalto, S. and Piironen, V. Factors affecting sample preparation in the gas chromatographic determination of plant sterols in whole wheat flour. Food Chem., 68, 239-245 (2000) (DOI: 10.1016/S0308-8146(99)00201-0).
- Winkler, J.K., Rennick, K.A., Eller, F.J. and Vaughn, S.F. Phytosterol and tocopherol components in extracts of corn distillers dried grain. J. Agric. Food Chem., 55, 6482-6486 (2007) (DOI: 10.1021/jf070594q).
- Phillips, K.M., Tarragó-Trani, M.T. and Stewart, K.K. Phytosterol content of experimental diets differing in fatty acid composition. Food Chem., 64, 415-422 (1999) (DOI: 10.1016/S0308-8146(98)00090-9).
- Mandl, A., Reich, G. and Lindner, W. Detection of adulteration of pumpkin seed oil by analysis of content and composition of specific Δ7-phytosterols. Eur. Food Res. Technol., 209, 400-406 (1999) (DOI: 10.1007/s002170050516).
- Kornfeldt, A. and Croon, L.-B. 4-Demethyl, 4-monomethyl, and 4,4-dimethylsterols in some vegetable oils. Lipids, 16, 306-314 (1981) (DOI: 10.1007/BF02534954).
- Farines, M., Cocallemen, S. and Soulier, J. Triterpene alcohols, 4-methylsterols, and 4-desmethylsterols of eggplant seed oil: a new phytosterol. Lipids, 23, 249-354 (1988) (DOI: 10.1007/BF02537347).
- Azadmard-Damirchi, S. and Dutta, P. Novel solid-phase extraction method to separate 4-desmethyl-, 4-monomethyl-, and 4,4’-dimethylsterols in vegetable oils. J. Chromatogr. A, 1108, 183-187 (2006) (DOI: 10.1016/j.chroma.2006.01.015).
- Azadmard-Damirchi, S., Nemati, M., Hesari, J., Ansarin, M. and Fathi-Achachlouei, B. Rapid separating and enrichment of 4,4’-dimethylsterols of vegetable oils by solid-phase extraction. J. Am. Oil Chem. Soc., 87, 1155-1159 (2010) (DOI: 10.1007/s11746-010-1595-9).
- Zhang, X., Cambrai, A., Miesch, M., Roussi, S., Raul, F., Aoude-Werner, D. and Marchioni, E. Separation of Δ5- and Δ7-phytosterols by adsorption chromatography and semipreparative reversed phase high-performance liquid chromatography for quantitative analysis of phytosterols in foods. J. Agric. Food Chem., 54, 1196-1202 (2006) (DOI: 10.1021/jf052761x).
- Dutta, P.C. and Normén, L. Capillary column gas-liquid chromatographic separation of Δ5-unsaturated and saturated phytosterols. J. Chromatogr. A, 816, 177-184 (1998) (DOI: 10.1016/S0021-9673(98)00520-2).
- Wenzl, T., Prettner, E., Schweiger, K. and Wagner, F.S. An improved method to discover adulteration of Styrian pumpkin seed oil. J. Biochem. Biophys. Methods, 53, 193-202 (2002) (DOI: 10.1016/S0165-022X(02)00108-2).
- Patterson, G.W. Relation between structure and retention time of sterols in gas chromatography. Anal. Chem., 43, 1165-1170 (1971) (DOI: 10.1021/ac60304a015).
- Thompson, R.H., Patterson, G.W., Thompson, M. and Slover, H.T. Separation of pairs of C-24 epimeric sterols by glass capillary gas liquid chromatography. Lipids, 16, 694-699 (1981) (DOI: 10.1007/BF02535066).
- Moreau, R.A., Liu, K., Winkler-Moser, J.K. and Singh, V. Changes in lipid composition during dry grind ethanol processing of corn. J. Am Oil Chem. Soc., 88, 435-442 (2011) (DOI: 10.1007/s11746-010-1674-y).
- Goad, L.J. and Akihisa, T. Analysis of Sterols. (Blackie Academic and Professional, Chapman and Hall, London, UK) (1997).
- Rahier, A. and Benviste, P. Mass spectral identification of phytosterols. In: Analysis of Sterols and Other Biologically Significant Steroids. pp. 223-250 (W.D. Nes and E.J. Parish, (eds), Academic Press, Inc, San Diego, CA) (1989).
- Ettre, L.S. and Kabot, F.J. Relative response of fatty acid methyl esters on the flame ionization detector. J. Chromatogr., 11, 114-116 (1963) (DOI: 10.1016/S0021-9673(01)80880-3).
- Costin, C.D., Hansen, S.L. and Chambers, D.P. Using theoretical correction factors for quantitative analysis of sterols and sterol concentrates. J. Am. Oil Chem. Soc., 86, 111-118 (2009) (DOI: 10.1007/s11746-008-1332-9).
- AOCS Official Method Ce 1h-05 Determination of cis-, trans-, saturated, monounsaturated, and polyunsaturated fatty acids in vegetable or non-ruminant animal oils and fats by capillary GLC. In: Official Methods and Recommended Practices of the AOCS, 6th Edition. (D. Firestone (ed), AOCS, Urbana, IL) (2009).
In This Section
- Solid-phase extraction columns in the analysis of lipids
- Preparation of Ester Derivatives of Fatty Acids for Chromatographic Analysis
- Preparation of Lipid Extracts Tissues
- The Chromatographic Resolution of Chiral Lipids
- Detectors for HPLC of Lipids with Special Reference to Evaporative Lght-Scattering Detection
- Why Doesn't Your Method Work When I Try It?
- Laboratory Accreditation in a Lipid Analysis Context
- What Column do I Need for Gas Chromatographic Analysis of Fatty Acids?
- Fatty Acid Analysis by HPLC
- Alternatives to Methyl Esters for GC Analysis of Fatty Acids
- A Practical Guide to the Analysis of Conjugated Linoleic Acid (CLA)
- Application of Infrared Spectroscopy to the Rapid Determination of Total Saturated, trans, Monounsaturated, and Polyunsaturated Fatty Acids
- The Use of Lithiated Adducts for Structural Analysis of Acylglycerols by Mass Spectrometry with Electrospray Ionization
- Identification of FAME Double Bond Location by Covalent Adduct Chemical Ionization (CACI) Tandem Mass Spectrometry
- The Use of Countercurrent Chromatography (CCC) in Lipid Analysis
- Gas Chromatographic Analysis of Plant Sterols
- Analysis of Tocopherols and Tocotrienols by HPLC
- Reversed-Phase HPLC of Triacylglycerols
- Structural Analysis of Triacylglycerols
- Thin-Layer Chromatography of Lipids
- High-temperature Gas Chromatography of Triacylglycerols
- Modification of an AOCS Official Method for Crude Oil Content in Distillers Grains and Other Agricultural Materials
- Lipidomics - A Personal View