Application of Infrared Spectroscopy to the Rapid Determination of Total Saturated, trans, Monounsaturated, and Polyunsaturated Fatty Acids
The Authors: Magdi M. Mossoba, Hormoz Azizian and John K.G. Kramer
Vibrational Spectroscopy
Infrared (IR) spectroscopy is an old analytical technique that has been widely utilized as a routine tool by the fats and oils industry [1]. Since the first infrared spectra of fatty acids (FA) and vegetable oils were published by Coblentz in 1905, there has been a growing recognition by researchers and the food industry of the value of vibrational spectroscopy in lipid analysis.
Besides the fundamental role of mid-IR spectroscopy in basic research on lipids, its single most notable application for producers and processors of fats and oils has been the determination of total trans FAs. Mid-IR (400-4000 cm-1) provides information on fundamental vibrational modes whose band positions in observed spectra can be correlated to characteristic group frequencies and provide “fingerprints” that are used for identification and quantification of constituents of fats and oils.
Near-IR (NIR) spectroscopy (4000-14000 cm-1) offers other advantages, which account for its widespread use in the agricultural and food industries [2]. NIR spectra exhibit low-absorptivity combination and overtone bands of the fundamental vibration modes. As a result, longer pathlengths can be used that allow for the measurement of opaque, intact test samples (e.g., grains, seeds, and fats and oils) or those at higher concentrations relative to mid-IR. Besides transmission and diffuse reflection, the transflection mode with fibre optic probes is commonly used in NIR measurements. These advantages have made it possible for NIR spectroscopy in conjunction with multivariate statistical analysis to be routinely applied to compositional determinations, classifications, and prediction of functionality. Advanced chemometrics, such as partial least squares (PLS) regression, are required for the analysis of observed NIR spectra due to the overlap of broad combination and overtone bands.
trans Fat labeling and other regulatory actions in many countries prompted the food industry worldwide to accelerate food reformulation to reduce the amount of total trans fat in food products [3]. It also increased interest in the development of more rapid and equally reliable methods as gas chromatography (GC) for the determination of the FA composition of fat and oil products to monitor compliance with food regulations, such as those that require the declaration of the total fat, trans fat, and saturated fatty acid (SFA) contents, and to verify the values provided on the product labels.
Currently there is no unanimous consent among countries as to which trans FAs are to be included in the definition of total trans FA content [3]. Based on a strict chemical definition this would include all FAs having one or more double bonds in the trans configuration, irrespective of whether it is industrially produced during partial hydrogenation, naturally produced in ruminants, or as a result of food processing. This position was recently taken by Australia and New Zealand, and appears to imply that human milk, ruminant meats and dairy fats would be considered “unhealthy” [4]. Denmark and Switzerland have chosen to limit trans fats to industrially produced fats, while considering all ruminant-derived trans FAs as “healthy” [3]. The USA, Canada, the EU and Codex Alimentarius have also attempted to differentiate between the origins of the trans FAs by excluding from the definition of total trans FA content those that contain conjugated trans double bonds [3]. However, this definition presumes that all conjugated FAs are “healthy”, and all FAs containing isolated trans double bonds are not. This is not supported by scientific evidence; for example the isolated trans-11-18:1 (vaccenic acid) is the precursor of the conjugated cis-9,trans-11-18:2 (rumenic acid), and both exhibited beneficial health effects [5], while the conjugated trans-10,cis-12-18:2 reportedly exhibited adverse health effects [6-8]. While most regulatory policies assign manufacturers the responsibility of selecting an appropriate method for the determination of FA composition, the selected method has ensuring the validity of the declared nutrient values on labels of food products. In addition, the selected methods must allow the identification of the different trans FA isomers to meet various regulatory standards.
The body of literature on vibrational spectroscopy is vast and the number of applications is extensive. However, the present article on the application of IR to the determination of the FA composition of fats and oils is limited to two recent developments. It is focused specifically on: (1) the rapid determination of total trans fat by mid-IR spectroscopy, and in particular by applying the negative second derivative attenuated total reflection-Fourier transform-mid-IR (ATR-FTIR) official method, and (2) the novel, rapid determination of total SFA, trans FA, monounsaturated fatty acid (MUFA) and polyunsaturated fatty acid (PUFA) by using FT-NIR spectroscopy and PLS regression.
Rapid Determination of Total trans Fat by Mid-infrared Spectroscopy
A significant number of mid-infrared (IR) spectroscopic procedures and several official methods for quantifying total trans FAs with isolated double bonds have been published over the past sixty years as interest in an optimized methodology steadily increased. A few procedures [9-12] have since been validated through national and/or international multi-laboratory collaborative studies and adopted as official methods [13-17]. An introduction to the scope of this mid-IR determination as well as a discussion about its strength and limitations is given below.
The determination of total isolated trans FA in fats and oils by various mid-IR procedures [11,12] and official methods [13-17] is based on the measurement of the unique C-H out-of-plane deformation band observed at 966 cm-1 (Fig. 1) that is highly characteristic of isolated (non-conjugated) double bonds with trans configuration. In partially hydrogenated fats and oils, these trans double bonds are found mostly in trans-18:1 positional isomers, and at lower levels in minor products, such as cis/trans and trans/trans methylene-interrupted (e.g., cis-9,trans-12-18:2 and trans-9,trans-12-18:2), and non-methylene-interrupted FAs (e.g., cis-9,trans-13-18:2 and trans-9,trans-13-18:2). More complex mixtures of trans-containing PUFA and their positional isomers may occur in partially hydrogenated fish oils. Mid-IR methodology has been extensively used in the edible fats and oils industry. The more recently validated ATR-FTIR methodologies described below can be applied directly to neat (undiluted in any solvent) triacylglycerols (TAG). By contrast, fatty acid methyl ester (FAME) derivatives are required for GC analysis, while FAME can be measured by ATR-FTIR as easily as TAG.
Figure 1. Expanded region of mid-IR absorption spectra for trans fats. The deformation band for isolated trans double bonds is observed at 966 cm-1.
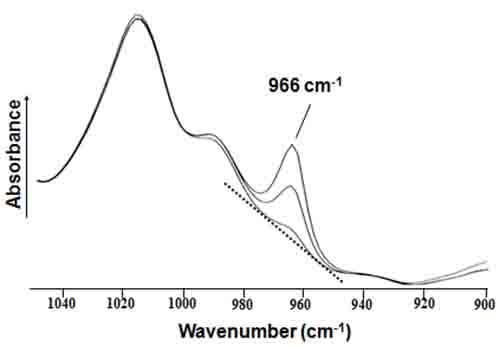
The highly characteristic trans absorption at 966 cm-1 (not found in the spectra of cis FA molecules) occurs on an elevated and sloping baseline due to TAG absorptions, and thus the measurement of its height or area becomes increasingly less accurate as the trans fat levels decrease particularly below approximately 5% of total fat (Fig. 1). Many modifications have been proposed to improve accuracy, but only some transmission [13-14] and more recently ATR [15-16] mid-IR official methods succeeded in partially improving this determination. This is because several previously undetected interferences, due to SFA, conjugated FA, and other minor products, adversely affected accuracy and precision. These issues were significantly minimized when the so-called negative second derivative ATR-FTIR procedure was proposed [12], validated, and approved as official method in 2009 [17].
Transmission FTIR Official Method AOCS Cd 14-95 and AOAC 965.3.
The most recent transmission mid-IR official methods, AOCS Cd 14-95 and AOAC 965.3 [13,14], provided only minor improvements over the older ones. The approach required the analysis of all fats and oils as FAME irrespective of the trans fat content. A brief description is given next.
This approach requires the accurate weighing of FAMEs and their dissolution in known volumes of volatile and toxic carbon disulfide solvent. FAME solutions are subsequently measured in non-demountable transmission cells with a 1-mm fixed-pathlength. FAME calibration standards consisting of known mixtures of methyl elaidate (trans-9-18:1) and methyl oleate (cis-9-18:1) in CS2 are prepared, such that the total concentration of FAMEs is the same (0.2 g/10 mL) for each standard. The total concentration of unknown test samples is also set at this concentration. This method assumes that the trans FA to be determined are only methyl elaidate, and that the absorptivities of the 966 cm-1 band for all trans FAs and their positional isomers are identical. This methodology requires the generation of two linear regression calibration functions, one for a first set of standards with t9-18:1 contents of ≤10% of total FAME and another for a second set with t9-18:1 levels >10% of total FAME. To measure the 966 cm-1 band height, a straight line is first drawn between two points along the sloping baseline of the infrared spectrum (Fig. 1). The positions of these two minima points are not the same and have to be moved closer to each other as the intensity of the trans FAME band at 966 cm-1 decreases.
The judgment of analysts in drawing baselines has been a significant source of error, and more reliable alternative procedures were subsequently developed.
ATR-FTIR Official Methods AOCS Cd 14d-99 and AOAC 2000.1
The introduction of ATR (also known as internal reflection) instead of transmission cells, resulted in a new mid-IR procedure that was developed, validated in a multi-laboratory collaborative study, and adopted as official method Cd 14d-99 by AOCS [15] and official method 2000.10 [16] by AOAC International. In comparative studies, better precision such as lower reproducibility relative standard deviation, RSD(R), values [9,10,18,19] were obtained by using the ATR-FTIR method [15,16] relative to transmission FTIR methods [13,14].
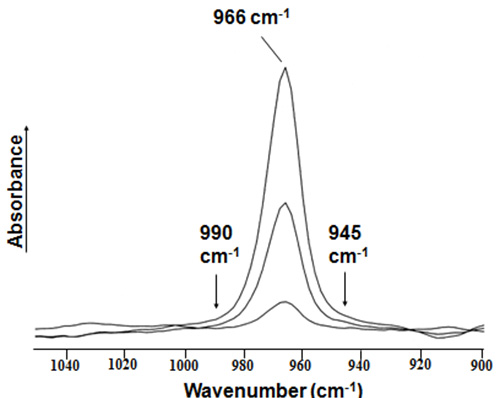
This ATR method was successfully used to rapidly (5 min) measure the 966-cm-1 trans fat absorption as a symmetric band on a nearly horizontal baseline (Fig. 2). The experimental setup of this ATR-FTIR official method offered several advantages and was simpler than the one used for transmission measurements. This method requires the measurement of trans fats relative to a reference material consisting of a trans-free oil. The internal reflection approach eliminated the need to weigh test portions and quantitatively prepare solutions in CS2. Traditionally, CS2 had been used as the reference material in the vast majority of transmission procedures and official methods [11,13,14]. When a trans-free oil reference material was used instead of CS2, the sloping baseline of the 966 cm-1 trans band became nearly horizontal [11,15,16,18,19]. Therefore, the contributions of the TAG absorptions that led to an elevated and sloping baseline in the first place were removed, and the requirement to convert TAG to their corresponding FAME was eliminated. Having a nearly horizontal baseline significantly reduced the uncertainty in measuring the band height or area at all trans fat levels.
Figure 2. Expanded region of mid-IR absorption spectra for trans fats measured relative to a trans-free reference oil. The deformation band for isolated trans double bonds is observed at 966 cm-1. The band areas are integrated in the fixed range between 990 and 945 cm-1.
Briefly, the experimental ATR-FTIR procedure consists of several steps. Calibration is achieved by first accurately preparing trans fat standards by adding varying amounts (0–50%) of neat (without any solvent) trielaidin (trans-9-18:1) to a neat trans-free reference oil. Next, a small volume (consisting of one to two drops) of a calibration standard is placed on top of the pre-heated (65°C) horizontal surface of the internal reflection element (usually made of zinc selenide or diamond) of a single- or multiple-reflection ATR accessory. Depending on the diameter of the internal reflection crystal, this small volume of TAG calibration standard can range from 50 µL to as little as 1 µL. It is noted that larger ATR crystals allow the infrared beam to bounce multiple times through the test portion under investigation. This means that the larger the number of internal reflections will result in greater sensitivity and will enhance the signal-to-noise ratio. This advantage will be most useful at low trans fat concentrations (below 5% of total fat). The ATR element surface must be completely covered for accurate quantification and extreme care should be taken in order to avoid cross contamination. To fully satisfy this last requirement, cleaning the ATR element with ethanol is recommended.
trans Reference trans-9-18:1 TAG calibration standards are measured by ATR-FTIR relative to that of a trans-free reference oil to obtain absorption spectra. The 966 cm-1 trans band for trans-9-18:1 spectra is usually exhibited as a symmetric feature on a nearly horizontal baseline. The area of the trans band could then be integrated electronically between the limits of 990 and 945 cm-1 (Fig. 2), which is used to generate a calibration function. The resulting regression function relating the integrated area of the absorption band and the amount of trans-9-18:1 TAG (as percent of total fat) usually has a negligible y-intercept and a regression coefficient R2 value of 0.999 [11,15,16,19]. Similarly, unknown fats and oils test portions are measured relative to the same trans-free reference oil used for calibration. The trans fat or oil level (as percent of total fat) is then calculated by substituting the value of the integrated area of the trans band in the linear regression function. As stated above, this ATR-FTIR method also assumes that the major component to be determined in unknown melted fat or oil test samples is trielaidin.
The FA composition of the trans-free reference oil is a critical aspect of this method. The FA composition of this trans-free reference oil should match as much as possible that of every unknown fat or oil being determined. If the selected trans-free oil is significantly different in composition from that of the fat under investigation, it will adversely impact the accuracy of quantification. For a complex matrix such as milk fat [20], finding a matching trans-free reference material proved to be difficult. Consequently, an accurate determination was found to be unsatisfactory particularly for trans fat levels below 5%, as percent of total fat [11,15,16,18,19]. This matrix interference was overcome by the negative second derivative ATR-FTIR procedure discussed next.
Negative Second Derivative ATR-FTIR Official Method AOCS Cd 14e-09
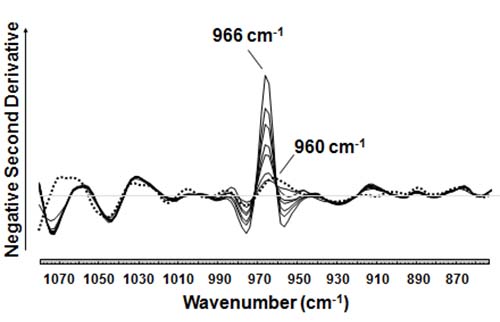
A novel ATR-FTIR spectroscopic procedure that allows the rapid measurement of the height of the negative second derivative of the trans absorption band (Fig. 3) was recently reported [12,21-25]. This procedure did not require the use of a trans-free oil, instead it referenced the measurement of trans fat relative to air (open-IR beam). This aspect of the procedure eliminated both the baseline offset and slope of the trans IR band (966 cm-1) as well as the need to measure test samples relative to a trans-free reference fat. Because second derivative spectroscopy enhances the curved features of an absorbance band and exhibits narrower bandwidths, for the first time it was possible to observe the presence of weak interference bands close to the trans absorption band at 966 cm-1. One type of interference was due to bands near or below 960 cm-1, which were confirmed to be due to the presence of saturated fat components [24]. For a fully hydrogenated soybean oil test sample [21] a band at 960 cm-1 was erroneously attributed to a 1.3% trans fat test sample. It was subsequently recognized that it should have been attributed to the saturated tristearin (TS, 18:0) [22]. The saturated trilaurin (TL, 12:0), trimyristin (TM, 14:0), tripalmitin (TP, 16:0), and triarachidin (TA, 20:0) were all found to exhibit similarly weak absorption bands slightly below 966 cm-1 with varying degrees of interferences at the normal 4 cm-1 resolution used for the analysis of fats and oils. Therefore, for fats and oils with a high content of saturated fats, but only a trace amount of trans fat (≤0.1% of total fat) such as coconut oil and cocoa butter, the weak bands observed at positions slightly lower than 966 cm-1 (Fig. 3) must not be erroneously interpreted as trans fat bands. This recognition of potential interferences from saturated fats resulted [22] in the correct interpretation of IR spectral bands for unknown fats and oils, and improved the accuracy of the IR spectroscopy determination of trans levels below 5% of total fat.
Figure 3. Expanded region of the negative second derivatives of mid-IR absorption spectra for trans fats. The deformation band for isolated trans double bonds is observed at 966 cm-1. The height of the negative second derivative band can be accurately measured from the horizontal line at y = 0. For coconut oil (dotted line) that is high in saturated fat, and contains a trace level of trans fat not detectable by mid-IR, a band near 960 cm-1 was observed.
The narrower bandwidth of second derivative absorption bands also allowed the spectral resolution of the 966 cm-1 band from spectral features attributed to conjugated trans,trans (near 990 cm-1) and/or cis/trans (near 987 and 950 cm-1) double bonds observed for milk fat [26]. An analytical solution to this problem based on standard addition was proposed [26]. In the case of conjugated FAs, however, second derivative spectra led to the total elimination of any band overlap [24].
This negative second derivative ATR-FTIR procedure was subsequently validated in an international collaborative study [24], and recently applied to the rapid determination of the total trans fat content of commercial fats and oils [25] for compliance verification with food labeling regulations.
Rapid Determination of Total SFA, trans FA, MUFA and PUFA by FT-NIR Spectroscopy and PLS
This section introduces FT-NIR as a novel tool for the rapid determination of FA composition. The FT-NIR procedure was proposed [27-30] and recently evaluated in a limited collaborative study [31], but has not been fully validated. A discussion is given next about the development of this procedure and its scope, advantages, and limitations.
Although ATR-FTIR has made significant strides towards the accurate determination of the total trans fat content, one still needed to rely on GC official methods for the determination of the total saturated fat content in order to comply with regulatory requirements. On the other hand, recent advances in FT-NIR spectroscopy have made it possible to determine not only the total trans FA content, but also the FA composition of a fat or oil [27-30] without the need for prior derivatization to volatile FAME derivatives as required for GC analysis. By using GC as the primary reference method, quantitative PLS calibration models were first developed [27] and subsequently applied to the rapid FA profiling of fats and oils by FT-NIR. FT-NIR has also been applied to the determination of conjugated trans FAs in the presence of isolated trans FAs [30]. While this FT-NIR procedure shows great potential, it still needs to be collaboratively studied in multiple laboratories and approved as an official method.
Several important conditions should be carefully considered and satisfied when reference GC data are used in the development of PLS calibration models for FT-NIR determination of the FA composition for fats and oils: All GC peaks must be reported and accounted for, the resolution of all GC components should be optimized, and quantification should be accurate. This is necessary because FT-NIR spectra are collected for the undiluted and underivatized neat fats and oils. They are strongly matrix dependent and represent all the constituents of the matrix including non-TAG components. Two assumptions were made during method development: (i) The position of a FA on the glycerol moiety had only a minimal effect, and (ii) FAME and TAG could be compared. The currently available very long (100 or 200 m) flexible fused silica capillary columns coated with highly polar stationary phases have made it possible to maximize the resolution of most FAME, including all trans FAMEs and their positional isomers. Advances in column technology have led to the development of significantly improved official methods, AOCS Ce 1h-05 [32] and AOAC 996.06 [33], for trans FAME analysis.
The GC methodology is based on the analysis of FAME prepared from fats and oils by chemical transesterification. All GC peaks should be accounted for, including unidentified minor ones that may be attributed to unknown FAME components or non-lipid matrix constituents. While the identification of all unknown GC peaks is not essential, their calculated concentrations must however be accounted for, included in the total fat content, and incorporated into PLS calibration models. If GC peaks attributed to non-lipid constituents are produced (e.g., as artifacts from the preparation of GC derivatives or as processing intermediates [34]), they should be removed from the total FA composition, since these artifacts are not constituents of the fat or oil, and would not have been found in the underivatized test portion measured by FT-NIR. It is therefore recommended to remove such artifacts by using thin layer chromatography to purify the prepared FAME products prior to GC analysis [35]. A careful reporting and accounting of all GC peaks is critical for developing robust quantitative PLS calibration models for subsequent FA profiling by FT-NIR.
With regard to the resolution of overlapping GC peaks, it is important to make every effort to resolve co-eluting or overlapping pairs of peaks. One recommended protocol entails the use of two different temperature programs [36] with the same GC instrument and column. The GC profiles from the two temperature programs should be sufficiently different to produce recognizable changes in the relative elution pattern of overlapping components, such that a co-eluting pair of peaks under one set of conditions do not co-elute again under a second temperature program. To improve accuracy of GC determinations, theoretical correction factors are recommended for the quantification of the flame-ionization detector response [9,37].
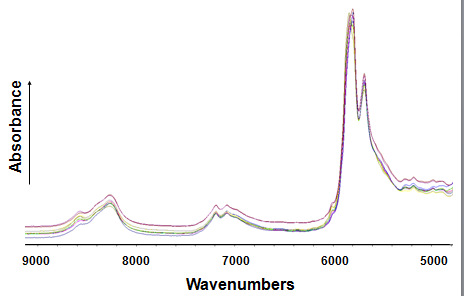
NIR spectra (Fig. 4) exhibit broad and overlapping combinations and overtones of fundamental mid-infrared stretching vibrations, namely C-H, C-O and N-H vibrations. For FA profiling, the most important bands are due to –CH, -CH2 and -CH3 groups that originate from either the FA chain or the glycerol moiety of the TAG and phospholipid molecules, or other constituents present in a lipid test portion. Thus, it is difficult to attribute or assign an individual band to a particular functional group, as it is customarily done for mid-IR spectra. In order to extract relevant information on FA composition from these NIR spectral fingerprints, multivariate statistical analysis is required. A common quantitative chemometrics tool used for data analysis is PLS regression. To develop PLS calibration models several issues have to be considered. A NIR spectrum is uniquely characteristic of the test sample under investigation; it will reflect all mixture components whether they are part of the fat being analyzed or present as contaminants, and it is strongly matrix dependent. Therefore, factors such as residual solvent effects, temperature, and minor non-lipid constituents of edible oils must carefully be accounted for and resolved during the time-consuming development stage of calibration models. The subsequent application of these models to the determination of total SFA, trans FA, MUFA and PUFA is rapid (<5 min), fully automated, and independent of analyst bias. The measurement of FT-NIR spectra is also rapid (<1 min). In a recent limited three-laboratory collaborative study, FT-NIR determination of the FA compositions of six selected fats and oils proved to be comparable to those obtained by GC [31,37].
Figure 4. Typical FT-near IR spectra observed for 10 different edible fats and oils.
Various calibration models for FA analysis of vegetable oils were developed [27,28] and are available commercially. They include a low trans fat model, a low-to-medium trans fat model, a saturated fat model, and a cis-unsaturated fat model. A typical FT-NIR analysis of selected vegetable oils together with comparative GC data is given in Table 1.
| Table 1. Comparative determination (% of total fat) of representative edible oils by GC and FT-NIR* | ||||||
| Product | Methodology** | Σ SFA | Σ trans FA | Σ MUFA | Σ PUFA | |
| Partially hydrogenated soybean oil | GC | 18.7 | 28.6 | 27.9 | 20.4 | |
| FT-NIR | Mean | 18.1 | 28.0 | 29.6 | 22.1 | |
| SD | 0.8 | 1.5 | 1.9 | 0.5 | ||
| RMSECV | 1.6 | 1.6 | 3.0 | 1.4 | ||
| Soybean oil |
GC | 16.0 | 1.6 | 21.5 | 61.6 | |
| FT-NIR | Mean | 16.7 | 1.5 | 22.7 | 60.5 | |
| SD | 0.7 | 0.2 | 1.8 | 0.8 | ||
| RMSECV | 1.0 | 1.3 | 2.3 | 2.0 | ||
| Canola oil |
GC | 8.0 | 1.7 | 63.3 | 25.8 | |
| FT-NIR | Mean | 8.4 | 1.2 | 63.3 | 25.5 | |
| SD | 1.0 | 1.3 | 2.3 | 2.0 | ||
| RMSECV | 1.6 | 1.6 | 3.0 | 1.4 | ||
| Sunflower oil |
GC | 11.7 | 0.8 | 24.5 | 62.7 | |
| FT-NIR | Mean | 11.5 | 1.1 | 24.3 | 62.8 | |
| SD | 0.3 | 0.2 | 1.0 | 1.6 | ||
| RMSECV | 1.0 | 1.3 | 2.3 | 2.0 | ||
| Coconut oil |
GC | 89.1 | 1.5 | 7.3 | 1.8 | |
| FT-NIR | Mean | 89.4 | 1.7 | 7.3 | 1.7 | |
| SD | 0.7 | 0.5 | 0.4 | 0.2 | ||
| RMSECV | 1.2 | 0.6 | 2.3 | 0.6 | ||
| Palm oil |
GC | 52.9 | 2.1 | 36.4 | 8.9 | |
| FT-NIR | Mean | 53.0 | 3.2 | 37.1 | 8.9 | |
| SD | 0.8 | 0.5 | 1.4 | 0.1 | ||
| RMSECV | 1.2 | 0.6 | 2.3 | 0.6 | ||
* Data summarized from results presented in Azizian et al. [31] **GC column used was a 100 m SP 2560 (Supelco); FT-NIR values were means of nine measurements; SD, standard deviation; RMSECV, root mean square error of cross validation |
||||||
In conclusion, the current method of choice for the determination of FA composition of edible fats and oils is still GC. However, if speed of analysis is important, then IR spectroscopic methods can be used as acceptable and reliable alternatives for the routine measurement of large numbers of test samples. Current nutrition labeling and other requirements in many countries to declare on nutrition facts panels the total fat, SFA, trans FA, MUFA and PUFA contents of fats and oils, food products, and dietary supplements could certainly be met more conveniently and rapidly by using FT-NIR spectroscopy. Should only the total trans fat content be needed, official ATR-FTIR spectroscopic methods could also be used as acceptable alternatives.
The information presented in this article should enable students and established researchers to include these rapid, “green” mid- and near-IR techniques that often require little sample preparation in their analytical toolbox. It should also encourage investigators to consider applying them to their research or process monitoring needs in lipid science and related fields.
References
- Ismail, A.A., Nicodemo, A., Sedman, J., Van de Voort, F. and Holzbauer, I.E. Infrared spectroscopy of lipids: principles and applications. In: Spectral Properties of Lipids, pp. 235-269 (R.J. Hamilton and J. Cast, eds., Sheffield Academic Press and CRC Press, Boca Raton, FL) (1999).
- Near-Infrared Technology in the Agricultural and Food Industries (P. Williams and K. Norris, eds., American Association of Cereal Chemists, Inc, St Paul, MN) (1987).
- Duhem, K. Legislation relating to trans acids. In: Trans Fatty Acids in Human Nutrition, pp. 381-394 (Destaillats, F., Sébédio, J.-L., Dionisi, F. and Chardigny, J.-M. (eds). The Oily Press, Bridgwater) (2009).
- http://www.news-medical.net/health/Trans-Fat-Regulation.aspx
- Field, C.J., Blewett, H.H., Proctor, S. and Vine, D. Human health benefits of vaccenic acid. Appl. Physiol. Nutr. Metab., 34, 979-991 (2009) (DOI: 10.1139/H09-079).
- Tricon, S., Burdge, G.C., Kew, S., Banerjee, T., Russell, J.J., Jones, E.L., Grimble, R.F., Williams, C.M., Yaqoob, P. and Calder, P.C. Opposing effects of cis-9,trans-11 and trans-10,cis-12 conjugated linoleic acid on blood lipids in healthy humans. Am. J. Clin. Nutr., 80, 614-620 (2004).
- Larsen T.M., Toubro, S. and Astrup, A. Efficacy and safety of dietary supplements containing CLA for the treatment of obesity: evidence from animal and human studies. J. Lipid Res., 44, 2234-2241 (2003) (DOI: 10.1194/jlr.R300011-JLR200).
- Tholstrup, T., Raff, M., Straarup, E.M., Lund, P., Basu, S. and Bruun, J.M. An oil mixture with trans-10,cis-12 conjugated linoleic acid increases markers of inflammation and in vivo lipid peroxidation compared with cis-9,trans-11 conjugated linoleic acid in postmenopausal women. J. Nutr., 138, 1445-1451 (2008).
- Mossoba, M.M. and Kramer J.K.G. Official Methods for the Determination of Trans Fat (Second Edition, AOCS Press) (2009).
- Mossoba, M.M., Kramer, J.K.G., Delmonte, P., Yurawecz, M.P. and Rader, J.I. Determination of trans fats by gas chromatography and infrared methods. pp. 47-70. In: Trans Fats Alternatives (Kodali, D.R. and List, G.R. (eds), AOCS Press) (2005).
- Mossoba, M.M., Yurawecz, M.P. and McDonald, R.E. Rapid determination of the total trans content of neat hydrogenated oils by attenuated total reflection spectroscopy. J. Am. Oil Chem. Soc., 73, 1003-1009 (1996).
- Mossoba, M.M., Seiler, A., Kramer, J.K.G., Milosevic, V., Milosevic, M., Azizian, H. and Steinhart, H. Nutrition labeling: Rapid determination of total trans fats by using internal reflection infrared spectroscopy and a second derivative procedure. J. Am. Oil Chem. Soc., 86, 1037-1045 (2009) (DOI: 10.1007/s11746-009-1444-x).
- AOCS Official Method Cd 14d-95, Isolated trans Isomers Infrared Spectroscopic Method (Reapproved 1997).
- AOAC Official Method 965.34, Isolated Trans Isomers in Margarine and Shortenings (1997).
- AOCS Official Method Cd 14d-99, Rapid Determination of Isolated trans Geometric Isomers in Fats and Oils by Attenuated Total Reflection Infrared Spectroscopy (revised 1999).
- AOAC Official Method 2000.10, Determination of Total Isolated trans Unsaturated Fatty Acids.
- AOCS Official Method Cd 14e-09, Negative Second Derivative Infrared Spectroscopic Method for the Rapid (5 min) Determination of Total Isolated trans Fat (2009).
- Adam, M., Mossoba, M.M. and Lee, T. Rapid determination of total trans fat content by attenuated total reflection infrared spectroscopy: An international collaborative study. J. Am. Oil Chem. Soc., 77, 457-462 (2000).
- Mossoba, M.M, Adam, M. and Lee, T. Rapid determination of total trans fat content. An attenuated total reflection infrared spectroscopy international collaborative study. J. AOAC Int., 84, 1144-1150 (2001).
- Kramer, J.K.G., Feller, V., Dugan, M.E.R., Sauer, F.D., Mossoba, M.M. and Yurawecz, M.P. Evaluating acid and base catalysts in the methylation of milk and rumen fatty acids with special emphasis on conjugated dienes and total trans fatty acids. Lipids, 32,1219-1228 (1997).
- Milosevic, M., Milosevic, V., Kramer, J.K.G., Azizian, H. and Mossoba, M.M. Determining low levels of trans fatty acids in foods by an improved ATR-FTIR procedure. Lipid Technol., 16, 229-231 (2004).
- Mossoba, M.M., Kramer, J.K.G., Milosevic, V., Milosevic, M. and Azizian, H. Interference of saturated fats in the determination of low levels of trans fats (below 0.5%) by infrared spectroscopy. J. Am. Oil Chem. Soc., 84, 339-342 (2007) (DOI: 10.1007/s11746-007-1038-4).
- Mossoba, M.M., Milosevic, V., Milosevic, M., Kramer, J.K.G. and Azizian, H. Determination of total trans fats and oils by infrared spectroscopy for regulatory compliance. Anal. Bioanal. Chem., 389, 87-92 (2007).
- Mossoba, M.M., Seiler, A., Steinhart, H., Kramer, J.K.G., Rodrigues-Saona, L., Griffith, A.P., Pierceall, R., van de Voort, F.R., Sedman, J., Ismail, A.A., Barr, D., Da Costa Filho, P.A., Li, H., Zhang, Y., Liu, X. and Bradley, M. Regulatory infrared spectroscopic method for the rapid determination of total isolated trans fat: A collaborative study. J. Am. Oil Chem. Soc., 88, 39-46 (2011) (DOI: 10.1007/s11746-010-1648-0).
- Mossoba, M.M., Kramer, J.K.G., Azizian, A., Kraft, J., Delmonte, P., Fardin Kia, A.-R., Bueso, F.J., Rader, J.I. and Lee, J.K. Application of a novel, heated, nine-reflection ATR crystal and a portable FTIR spectrometer to the rapid determination of total trans fat. J. Am. Oil Chem. Soc., 89, 419-429 (2012) (DOI: 10.1007/s1 1746-011-1930-9).
- Mossoba, M.M., Kramer, J.K.G., Fritsche, J., Yurawecz, M.P., Eulitz, K., Ku, Y. and Rader, J.I. Application of standard addition to eliminate conjugated linoleic acid and other interferences in the determination of total trans fatty acids in selected food products by infrared spectroscopy. J. Am. Oil Chem. Soc., 78, 631-634 (2001).
- Azizian, H. and Kramer, J.K.G. A rapid method for the quantification of fatty acids in fats and oils with emphasis on trans fatty acids using Fourier transform near infrared spectroscopy (FT-NIR). Lipids, 40, 855-867 (2005).
- Azizian, H., Kramer, J.K.G.. and Winsborough, S.L. Factors influencing the fatty acid determination in fats and oils using Fourier transform near-infrared spectroscopy. Eur. J. Lipid Sci. Technol., 109, 960-968 (2007) (DOI: 10.1002/ejlt.200700062).
- Azizian, H. and Kramer, J.K.G. Application of FT-NIR for rapid determination of the trans fatty acid composition in fats and oils. pp. 303-334. In: Lipid Analysis and Lipidomics - New Techniques and Applications (Mossoba, M.M., Kramer, J.K.G., Brenna, J.T. and McDonald, R.E., (eds), AOCS Press, Champaign, IL) (2006).
- Azizian, H., Kramer, J.K.G., Kamalian, A.R., Hernandez, M., Mossoba, M.M. and Winsborough, S.L. Quantification of trans fatty acids in foods by GC, ATR-FTIR and FT-NIR methods. Lipid Technol., 16, 229-231 (2004).
- Azizian, H., Kramer, J.K.G. and Mossoba, M.M. Evaluating the transferability of FT-NIR calibration models for fatty acid determination of edible fats and oils among five same-make spectrometers using transmission or transflection modes with different pathlengths. J. Am. Oil Chem. Soc., 89, 2143-2154 (2012) (DOI: 10.1007/s11746-012-2116-9).
- AOCS Official Method Ce 1h-05 Determination of cis-, trans-, saturated, monounsaturated and polyunsaturated fatty acids in vegetable or non-ruminant animal oils and fats by capillary GLC. AOCS, Champaign, IL, 2005.
- AOAC Official Method 996.06, Fat (total, saturated, and unsaturated) in foods. Hydrolytic extraction gas chromatographic method, revised 2001.
- Azizian, H., Kramer, J.K.G., Ehler, S. and Curtis, J.M. Rapid quantitation of the fatty acids of fish oil and their ethyl esters. Eur. J. Lipid Sci. Technol., 112, 452-462 (2010) (DOI: 10.1002/ejlt.200900186).
- Cruz-Hernandez, C., Deng, Z., Zhou, J., Hill, A.R., Yurawecz, M.P., Delmonte, P., Mossoba, M.M., Dugan, M.E.R. and Kramer, J.K.G. Methods to analyze conjugated linoleic acids (CLA) and trans-18:1 isomers in dairy fats using a combination of gas chromatography, silver-ion thin-layer chromatography/gas chromatography, and silver-ion liquid chromatography. J. AOAC Int., 87, 545-562 (2004).
- Kramer, J.K.G., Hernandez, M., Cruz-Hernandez, C., Kraft, J. and Dugan, M.E.R. Combining results of two GC separations partly achieves determination of all cis and trans 16:1, 18:1, 18:2, and 18:3 except CLA isomers of milk fat as demonstrated using Ag-ion SPE fractionation. Lipids, 43, 259-273 (2008) (DOI: 10.1007/s11745-007-3143-4).
- Azizian, H., Kramer, J.K.G. and Mossoba, M.M. Progression of fatty acid profiling of edible fats and oils using vibrational spectroscopy. pp. 519-537. In: Applications of Vibrational Spectroscopy in Food Science, Vol II. Analysis of food drink and related materials (Li-Chan, E.C.Y., Griffiths, P.R. and Chalmers, J.M. (eds), Wiley, Chichester) (2010).
In This Section
- Solid-phase extraction columns in the analysis of lipids
- Preparation of Ester Derivatives of Fatty Acids for Chromatographic Analysis
- Preparation of Lipid Extracts Tissues
- The Chromatographic Resolution of Chiral Lipids
- Detectors for HPLC of Lipids with Special Reference to Evaporative Lght-Scattering Detection
- Why Doesn't Your Method Work When I Try It?
- Laboratory Accreditation in a Lipid Analysis Context
- What Column do I Need for Gas Chromatographic Analysis of Fatty Acids?
- Fatty Acid Analysis by HPLC
- Alternatives to Methyl Esters for GC Analysis of Fatty Acids
- A Practical Guide to the Analysis of Conjugated Linoleic Acid (CLA)
- Application of Infrared Spectroscopy to the Rapid Determination of Total Saturated, trans, Monounsaturated, and Polyunsaturated Fatty Acids
- The Use of Lithiated Adducts for Structural Analysis of Acylglycerols by Mass Spectrometry with Electrospray Ionization
- Identification of FAME Double Bond Location by Covalent Adduct Chemical Ionization (CACI) Tandem Mass Spectrometry
- The Use of Countercurrent Chromatography (CCC) in Lipid Analysis
- Gas Chromatographic Analysis of Plant Sterols
- Analysis of Tocopherols and Tocotrienols by HPLC
- Reversed-Phase HPLC of Triacylglycerols
- Structural Analysis of Triacylglycerols
- Thin-Layer Chromatography of Lipids
- High-temperature Gas Chromatography of Triacylglycerols
- Modification of an AOCS Official Method for Crude Oil Content in Distillers Grains and Other Agricultural Materials
- Lipidomics - A Personal View