The NMR Spectrum
The Author: Frank D. Gunstone, James Hutton Institute (and Mylnefield Lipid Analysis), Invergowrie, Dundee (DD2 5DA), Scotland
13C-NMR spectra are based on natural 13C, which occurs at a level of 1.1% in organic compounds. The spectra provide two kinds of information:
- the chemical shift of each signal (usually 50 to 100 in a natural mixture)
- their relative intensities.
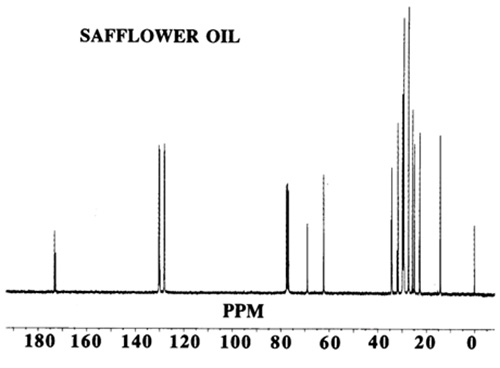
The former is of qualitative value and permits identification of important structural features; the latter, with approved safeguards, provides quantitative information of analytical value. Chemical shifts may vary slightly with concentration of the solution under study and (rather more) with the solvent. Most measurements are made with solutions of about 1 M concentration, and CDCl3 is the solvent most commonly employed. If a solvent is not indicated in the following discussion, it is probably CDCl3. Other solvents include CD3OD-CDCl3 mixtures, (CD3)2SO, D2O and C6D6. Figures 1 and 2 show typical spectra of vegetable oils.
Figure 1. 13C-NMR spectrum of safflower oil.
Figure 2. 13C
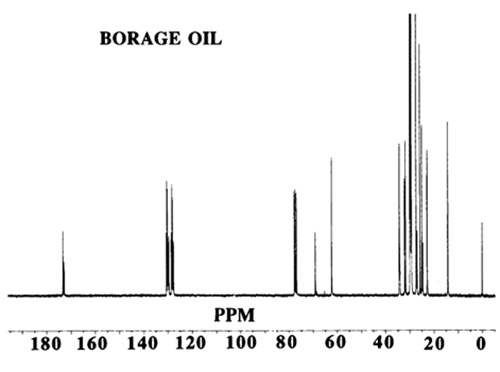
The chemical shift of a carbon atom depends on its total environment to a distance of six or more atomic centres. For example, in glycerol trioleate the signals for the olefinic carbon atoms (C9 and C10) differ from one another and also to a small extent depending on whether the oleate is an α or β chain (attached to a primary or secondary glycerol hydroxyl group). The C1 signal is also different for saturated and Δ9 chains. In these examples, the difference is produced by structural changes up to 11 atomic centres away. This makes the spectrum more complex but also more informative when all the chemical shifts have been assigned. As another example, the methyl groups at the end of each acyl chain in glycerol tripalmitate give a signal at about 14.1 ppm, which is well separated from other signals and hence easily recognised. The difference between α and β chains in this molecule is too small to be observed but in a vegetable oil containing saturated and unsaturated chains, the resonance at 14.1 ppm may appear as a cluster of two or more signals. Each is indicative of a different environment for the methyl group and may result from n-3, n-6, or n-9 acids where the closest double bond affects the chemical shift of the methyl signal.
To obtain quantitative data, attention has to be given to the protocol for obtaining the spectrum. In particular, the problem of relaxation has to be overcome either by adding a relaxation agent such as Cr(acac)3 (chromium acetonylacetonoate) and/or by including a delay time between successive scans of the spectrum. This will add to the time required to collect the spectrum. Spectrometers now available operate at a frequency for 13C of 68 MHz or more, and spectra are generally obtained using an NOE [nuclear Overhauser effect]-suppressed, inverse-gated, proton-decoupled technique. Exciting pulses have a 45-90° pulse angle, and acquisition times (including delay times) are 1-20 sec per scan. The number of scans is usually 1000 or more. The sample size for a routine 13C-NMR spectrum is 50-100 mg but by investment in a large number of scans high-quality spectra can be obtained with as little as 1 mg.
In using 13C-NMR data (chemical shifts and intensities) the first step is to assign as many of the chemical shifts as possible and other sections of this web site provide useful data. If the substance under study is a mixture, then many individual signals will be replaced by clusters. This makes interpretation more difficult but eventually provides additional information. It is wise to start the interpretation of a spectrum with the signals of greatest intensity and to ignore those in the methylene envelope that result from mid-chain carbon atoms in the region 29.4-29.9 ppm not greatly influenced by nearby functional groups. Instead, examine the easily recognised shifts associated with the carbon atoms: ω-1 (14.1 ppm), ω-2 (22.8), ω-3 (32.1), C1 (174.1), C2 (34.2), C3 (25.1), glycerol (68.9 and 62.1), olefinic (127-132) and allylic (27.3 and 25.6).
Assignments of chemical shift are now often made on the basis of available knowledge, such as that collated in these reviews. Existing information has been built up over the past 20 years assisted by the study of 2H-containing compounds and the use of chemical shift reagents. Where the necessary information is not available, more advanced spectroscopic procedures such as 2D COSY (two-dimensional correlation spectroscopy), INADEQUATE (incredible natural abundance double quantum transfer experiment) HSQC (heteronuclear single quantum correlation), HMQC (heteronuclear multiple quantum correlation), and HMBC (heteronuclear multiple bonds correlation) can be employed.
References
These articles are concerned mainly with the chemical shifts that have been reported for a wide range of fatty acids and their derivatives, and they are an updating of my review which appeared in Advances in Lipid Methodology - Two. pp. 1-68 (ed. WW Christie, Oily Press, Dundee) (1993). Other useful review articles are listed below.
- Aitzetmuller, K. Recent developments in the analysis of food lipids and other lipids. Oleagineux Corps Gras Lipides, 4, 8-19 (1997).
- Diehl, B.W.K. Multinuclear high-resolution nuclear magnetic resonance spectroscopy. In: Lipid Analysis in Oils and Fats. pp. 87-135 (ed. R.J. Hamilton, Blackie, London) (1998).
- Gunstone, F.D. 13C-NMR of lipids. In: Developments in the Analysis of Lipids. pp. 109-122 (ed. J.H.P. Tyman and M.H. Gordon, Royal Society of Chemistry) (1994).
- Gunstone, F.D. High resolution 13C-NMR - a technique for the study of lipid structure and composition. Prog. Lipid Res., 33, 19-28 (1994).
- Gunstone, F.D. Information about fatty acids derived by 13C nuclear magnetic resonance spectroscopy. In: New Trends in Lipid and Lipoprotein Analysis. pp. 250-264 (ed. J.-L. Sébédio and E.G. Perkins, AOCS Press, Champaign) (1995).
- Lie Ken Jie, M.S.F. and Mustafa, J. High-resolution nuclear magnetic resonance spectroscopy: Applications to fatty acids and triacylglycerols, Lipids, 32, 1019-1034 (1997).
- MacPherson, J.C., Bemis, D.L., Jacobs, R.S., Gerwick, W.H. and Todd, J. NMR in conjunction with GC-MS and UV methods: a case study on marine lipids. In: Spectral Properties of Lipids. pp. 97-122 (ed. R.J. Hamilton and J. Cast, Sheffield Academic Press, Sheffield) (1999).
- Spitzer, V. Screening analysis of unknown seed oils. Fett/Lipid, 101, 2-19 (1999).
In This Section
- Introduction of NMR
- Saturated Fatty Acids and Methyl Esters
- Alkyl Esters Other than Methyl
- Glycerol Esters
- Non-Conjugated Double Bonds
- Conjugated Linoleic Acid (CLA)
- Acetylenic Fatty Acids and Derivatives
- Branched-Chain and Cyclic Fatty Acids
- Epoxy Fatty Acids
- Hydroxy and Hydroperoxy Fatty Acids
- Oxo Fatty Acids
- Fatty Alcohols
- Some Miscellaneous Fatty Acids
- Quantification by 1H-NMR
- The NMR Spectrum
- Alkanoic Acids
- Monoenoic Acids
- Polyunsaturated Fatty Acids
- Non-Methylene-Interrupted Polyenoic Fatty Acids
- Acids with conjugated unsaturation
- Acetylenic and Allenic Acids and Esters
- Branched-Chain and Cyclic Fatty Acids
- Cyclic Fatty Acids
- Epoxides and Acyclic Ethers
- Hydroxy and Hydroperoxy Acids
- Oxo (Keto) Acids
- Acids, Esters (Alkyl, Glycerol, Waxes), Alcohols and Acetates, Amides, and Nitriles
- Esters of Glycerol and Other Polyhydric Alcohols
- Oils and Fats
- Regiospecific Analysis of Triacylglycerols