Glycerol Esters
The Author: Gerhard Knothe, National Center for Agricultural Utilization Research, Agricultural Research Service, U.S. Department of Agriculture, Peoria, IL, USA.
Triacylglycerol esters are the most common esters in which fatty acids occur naturally. In nature, triacylglycerols rarely exist in the form of a glycerol triester of only one fatty acid, but rather they are mixed species, i.e. glycerol esterified with more than one fatty acid. Figures 1 to 3 depict 1H-NMR spectra of various glycerol esters of stearic acid.
Besides the tripling of the integration values of the protons in the fatty acid chain, the NMR spectrum of tristearin, the triacylglycerol ester of stearic acid, shows the peaks for the sn-2 proton at about 5.3 ppm (triplet of triplets) and two distinct absorptions (4.17 and 4.33 ppm; both are doublets of doublets) of the sn-1 and sn-3 protons (HA1 and HA2; see structure inscribed in part a of Fig. 1). These assignments have been described in the literature (Lie Ken Jie and Lam, 1995), where also the dependence of these signals on the fatty acid chain attached to the glycerol moiety is discussed. The sn-2 (HB) protons for the triacylglycerols of saturated fatty acids were reported at 5.241-5.283 ppm in CDCl3, with values around 5.27 ppm common for mid-to long-chain fatty acid moieties. The sn-1 and sn-3 protons were reported at 4.142 to 4.161 ppm and 4.298 to4.326 ppm. The chemical shift ranges were similar for triacylglycerols of ABA and AAB type with saturated fatty acid chains.
![]() For triacylglycerols with acetylenic bonds with the structure illustrated (and with n = 0-10) the shifts were observed at 4.299 - 4.338 ppm (HA2), 4.123-4.302 (HA1; with the extreme value of 4.302 ppm for n = 0; n = 1 gave 4.231 ppm with increasing upfield shift with increasing n) and 5.260-5.331 ppm (HB; again the extreme of 5.331 ppm for n = 0; n = 1 gave 5.305 ppm). The situation was more complex for mixed triacylglycerols of AAB and ABA types with acetylenic fatty acids. For n ≥ 6, the positions of the fatty acid chains could not be unambiguously determined.
For triacylglycerols with acetylenic bonds with the structure illustrated (and with n = 0-10) the shifts were observed at 4.299 - 4.338 ppm (HA2), 4.123-4.302 (HA1; with the extreme value of 4.302 ppm for n = 0; n = 1 gave 4.231 ppm with increasing upfield shift with increasing n) and 5.260-5.331 ppm (HB; again the extreme of 5.331 ppm for n = 0; n = 1 gave 5.305 ppm). The situation was more complex for mixed triacylglycerols of AAB and ABA types with acetylenic fatty acids. For n ≥ 6, the positions of the fatty acid chains could not be unambiguously determined.
![]() For triacylglycerols of type AAA with fatty acid chains containing Z (cis) double bonds (fatty acid as illustrated with n = 0-10), HA = 4.299 - 4.350 ppm (4.350 ppm for n = 0; n = 1 gave 4.315 ppm), HA' = 4.140 - 4.268 ppm (4.268 ppm for n = 0; n = 1 gave 4.180 ppm), HB = 5.266 - 5.358 ppm (5.358 ppm for n = 0; n = 1 gave 5.284 ppm). For triacylglycerols of type AAA with similar fatty acid chains but containing E (trans) double bonds, HA = 4.296 - 4.363 ppm (4.363 ppm for n = 0; n = 1 gave 4.301 ppm), HA' = 4.138 - 4.291 ppm (4.291 ppm for n = 0; n = 1 gave 4.165 ppm), HB = 5.263 - 5.384 ppm (5.384 ppm for n = 0; n = 1 gave 5.268 ppm).
For triacylglycerols of type AAA with fatty acid chains containing Z (cis) double bonds (fatty acid as illustrated with n = 0-10), HA = 4.299 - 4.350 ppm (4.350 ppm for n = 0; n = 1 gave 4.315 ppm), HA' = 4.140 - 4.268 ppm (4.268 ppm for n = 0; n = 1 gave 4.180 ppm), HB = 5.266 - 5.358 ppm (5.358 ppm for n = 0; n = 1 gave 5.284 ppm). For triacylglycerols of type AAA with similar fatty acid chains but containing E (trans) double bonds, HA = 4.296 - 4.363 ppm (4.363 ppm for n = 0; n = 1 gave 4.301 ppm), HA' = 4.138 - 4.291 ppm (4.291 ppm for n = 0; n = 1 gave 4.165 ppm), HB = 5.263 - 5.384 ppm (5.384 ppm for n = 0; n = 1 gave 5.268 ppm).
| Table 1. Chemical shift of protons in the fatty acid chains of AAA-type triacylglycerols (source: Lie Ken Jie and Lam, 1995). |
||||
| R (in Glyc-O-CO-R)a | Chemical shifts | |||
|---|---|---|---|---|
| C2 | C3 | CH=CH | ||
| Saturated | ||||
| —CH3 | 2.073 (α), 2.087 (β) | - | - | |
| —CH2CH3 | 2.353, 2.356 | 1.138, 1.144 | - | - |
| —(CH2)2CH3 | 2.307, 2.312 | 1.651, 1.659 | - | - |
| —(CH2)3CH3 | 2.324, 2.331 | 1.632 | - | - |
| —(CH2)4CH3 | 2.316, 2.321 | 1.623 | - | - |
| —(CH2)16CH3 | 2.307 | 1.609 | - | - |
| Acetylenic | ||||
| —C≡C—(CH2)7CH3 | - | - | 2.334 (H-4) | - |
| —CH2—C≡C—(CH2)7CH3 | 3.269 | - | 2.181 (H-5) | - |
| —(CH2)2—C≡C—(CH2)7CH3 | 2.499 (m) | - | 2.111 (H-6) | - |
| —(CH2)3—C≡C—(CH2)7CH3 | 2.452 | 1.788 | 2.217 (4-H); 2.127 (7-H) | - |
| —(CH2)4—C≡C—(CH2)7CH3 | 2.343 | 1.723 | 2.146 (5-H and 8-H) | - |
| —(CH2)7—C≡C—(CH2)7CH3 | 2.310 | 1.616 | 2.129 (8-H and 11-H) | - |
| Z-Ethylenic | ||||
| —CH=CH—(CH2)7CH3 | 5.762, 5.770 | 6.264, 6.278 | 2.635 | see H at C2 and C3 |
| —CH2—CH=CH—(CH2)7CH3 | 3.101 | see -CH=CH- | 2.015 (5-H) | 5.325 |
| —(CH2)2—CH=CH—(CH2)7CH3 | 2.363 | 2.035 (6-H) | 5.325; 5.403, 5.443 | |
| —(CH2)3—CH=CH—(CH2)7CH3 | 2.322 | 1.675 | 2.056 (4-H), 1.991 (7-H) | 5.323; 5.391, 5.431 |
| —(CH2)4—CH=CH—(CH2)7CH3 | 2.322 | 1.635 | 2.036 (5-H and 8 H) | 5.369 |
| —(CH2)7—CH=CH—(CH2)7CH3 | 2.309 | 1.610 | 1.999 (8-H and 11 H) | 5.338 |
| E-Ethylenic | ||||
| —CH=CH—(CH2)7CH3 | 5.816, 5.829 | 6.986, 7.012 | 2.197 | see 2-H and 3-H |
| —CH2—CH=CH—(CH2)7CH3 | 3.031 | see -CH=CH- | 2.022 (5-H) | 5.524 |
| —(CH2)2—CH=CH—(CH2)7CH3 | 2.358 | 2.308 | 1.951 (6-H) | 5.420 |
| —(CH2)3—CH=CH—(CH2)7CH3 | 2.308 | 1.675 | 1.980 (4-H and 7-H) | 5.381 |
| —(CH2)4—CH=CH—(CH2)7CH3 | 2.311 | 1.618 | 1.974 (5-H and 8-H) | 5.380 |
| —(CH2)7—CH=CH—(CH2)7CH3 | 2.308 | 1.606 | 1.971 (8-H and 11-H) | 5.379 |
| aGlyc = glycerol moiety. | ||||
Figure 1a. 1H-NMR spectrum of tristearin.

Figure 1b. 1H-NMR spectrum of tristearin expanded in the region of 4-6 ppm.

In 1,3-distearin (Fig. 2), the signals of the sn-1 and sn-3 protons overlap (4.20 ppm integration value 4). The two remaining signals of integration value 1 are assigned to the protons at sn-2, namely 4.13 ppm, (overlapping the signals of the sn-1 and sn-3 protons, proton attached to the sn-2 carbon) and 2.48 ppm (doublet, OH proton at sn-2).
Figure 2. 1H-NMR spectrum of 1,3-distearin.

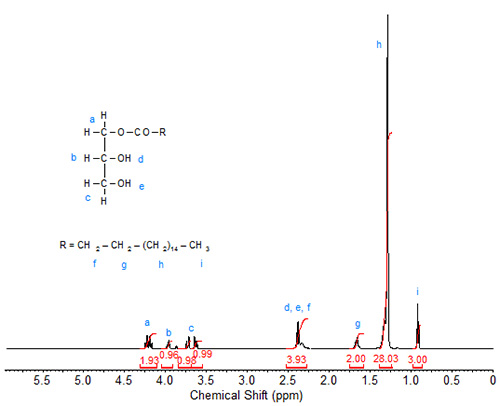
The 1H-spectrum of 1-monostearin (Fig. 3) is more complex. Each of the seven protons on the glycerol moiety gives a distinct signal. The two slightly overlapping downfield doublets of doublets at 4.18 and 4.25 ppm are again assigned to the carbon carrying the fatty acid chain (sn-1), similar to the assignments in di- and tristearin. The multiplet signals of the two protons directly attached to the sn-3 carbon are also split and observed at 3.64 and 3.73 ppm. The signal of the proton attached to the sn-2 carbon is observed at 3.97 ppm. The signals of the hydroxy protons overlap the triplet of the C2 protons in the fatty acid chain, giving this signal a theoretical integration value of 4. These assignments are verified by 2D heteronuclear correlation.
Figure 3. 1H-NMR spectrum of 1-monostearin.
Literature:
- Lie Ken Jie, M.S.F. and Lam, C.C. 1H-Nuclear magnetic resonance spectroscopic studies of saturated, acetylenic and ethylene triacylglycerols. Chem. Phys. Lipids, 77, 155-171 (1995).
In This Section
- Introduction of NMR
- Saturated Fatty Acids and Methyl Esters
- Alkyl Esters Other than Methyl
- Glycerol Esters
- Non-Conjugated Double Bonds
- Conjugated Linoleic Acid (CLA)
- Acetylenic Fatty Acids and Derivatives
- Branched-Chain and Cyclic Fatty Acids
- Epoxy Fatty Acids
- Hydroxy and Hydroperoxy Fatty Acids
- Oxo Fatty Acids
- Fatty Alcohols
- Some Miscellaneous Fatty Acids
- Quantification by 1H-NMR
- The NMR Spectrum
- Alkanoic Acids
- Monoenoic Acids
- Polyunsaturated Fatty Acids
- Non-Methylene-Interrupted Polyenoic Fatty Acids
- Acids with conjugated unsaturation
- Acetylenic and Allenic Acids and Esters
- Branched-Chain and Cyclic Fatty Acids
- Cyclic Fatty Acids
- Epoxides and Acyclic Ethers
- Hydroxy and Hydroperoxy Acids
- Oxo (Keto) Acids
- Acids, Esters (Alkyl, Glycerol, Waxes), Alcohols and Acetates, Amides, and Nitriles
- Esters of Glycerol and Other Polyhydric Alcohols
- Oils and Fats
- Regiospecific Analysis of Triacylglycerols