Oils and Fats in the Market Place
Introduction
Following my post-graduate training with T.P. Hilditch in Liverpool in the mid-1940s, I regarded lipids as molecules to be analysed, identified and synthesised, and with physical and chemical properties that I could study. Since I lost research facilities and the assistance of research students, I have come to think of lipids also as commodities, which have to be grown, harvested, extracted, refined, and traded across national boundaries to meet demands for food and nonfood purposes. In these web pages there are many tables of figures with appropriate commentary. For the most part I will be concerned with the present, the previous ten years, and with occasional predictions for the next five years. However, my first Table covers a longer time span and shows how the supply of oils and fats has grown, particularly in the last 100 years. As we shall see, most of these supplies are used for human food so it is reasonable to take note of population changes, and Table 1 includes a per person figure expressed in kg/person/year. This is obtained by dividing world production (which is very close to total disappearance – i.e. usage for all purposes) by world population. This represents total usage covering food, feed, and requirements of the oleochemical industry including biodiesel. Until recently it was widely accepted that the ratio for these three purposes was 80:6:14 but with the demands from the biodiesel sector this is now better represented by figures such as 75:5:20. These figures relate to the 17 animal fats and vegetable oils covered by Oil World. Different ratios are produced based only on the nine vegetable oils covered in monthly reports from the US Department of Agriculture.
| Table 1. Average annual production (million tonnes) and disappearance per person (kg/year) at selected times over almost 100 years |
||||||||
| 1909-13 | 1936-39 | 1958-62 | 2008-09 | |||||
|---|---|---|---|---|---|---|---|---|
| Production (mt) | 13.1 | 20.2 | 29.2 | 162.7 | ||||
| Population (bn) | 1.7 | 2.1 | 3.02 | 6.83 | ||||
| Per person (kg/year) | 7.7 | 9.6 | 9.7 | 23.8 | ||||
The first column (1909-13) relates to the years just before WW1 and the second (1936-39) to years after a serious world recession and immediately before WW2. The third column covers a time when the world was climbing out of the economic problems following WW2, and the final column is close to the present. The final two columns come from the same source (Oil World publications) and cover 17 commodity oils (see later). The earlier figures come from other sources and may cover a different range of commodities. The numbers therefore may not be strictly comparable but nevertheless the message is clear. There was a modest rise in production between the first and sixth decades of the 20th century, but because of the rise in population increase per person was from about 8 to 10 kg/person/year. However, the situation has been very different in the last 50 years. While population has doubled, production of oils and fats has increased fourfold so that the amount available per person has doubled. It will be useful to remember this framework as we look in more detail at present supply and demand.
Table 2 shows the availability of commodity oils and fats in the years when world population increased by successive billions. It is clear that as population has increased, the availability of oils and fats has increased more. In round figures when population increased from two to three billion oils and fats supply rose by 12 million tonnes. With successive billions of population oils and fats supplies rose by 16, 27, and 40 million tonnes (see Table). This increase is a consequence of three factors – a rise in area under cultivation (i.e. more land being used to grow trees and crops that produce oils and fats), a rise in average yields, and a rise in the proportion of the highest yielding source, viz. the oil palm.
| Table 2. Population (billion), oils and fats production (million tonnes), and amount per person per year (kg) at times when the world population was 1, 2, 3, 4, 5, and 6 billion |
|||
| Year | Population | Production | Per Person |
|---|---|---|---|
| 1825 | 1 | ? | ? |
| 1927 | 2 | 17.3 | 8.6 |
| 1960 | 3.02 | 29.2 | 9.7 |
| 1974 | 4.00 | 45.2 | 11.3 |
| 1987 | 5.02 | 72.3 | 14.4 |
| 2000 | 6.05 | 112.7 | 18.6 |
In a lecture (2001), James Fry reviewed the world’s oil and fat needs in the 21st century based on lessons from the 20th century. Discussing trend rates for the period 1975-1999, he gave figures appearing in Table 3 below for increases in output divided between those resulting from an increase in area under cultivation and those from an increase in yield. These results have to be interpreted with care. For example, yields of rapeseed are greater in Europe than in Canada and both are greater than in India. The world average yield will depend on the proportions of total crop grown in these three areas. Producing more rapeseed in Europe will raise the world average yield without changing the yields in any of these areas. It is clear that over this time period the large increase in palm output was due mainly to new plantations and hardly at all to higher yield.
| Table 3. Trend growth figures (%) between 1975 and 1999 divided between area and yield. | |||
| Oil | Output | Area | Yield |
|---|---|---|---|
| Soybean | 3.5 | 2.2 | 1.3 |
| Palm | 8.2 | 7.3 | 0.9 |
| Rapeseed | 7.1 | 4.4 | 2.4 |
| Sunflower | 5.5 | 4.2 | 1.2 |
Sources of Information
There are two major sources of useful information detailed here. There are other smaller sites and readers may care to share their insights with me.
Oil World (ISTA Mielke GmbH, www.oilworld.biz) is a Hamburg company devoted to the market analysis of oils and fats. It was started in 1958 by Siegfried Mielke and is now managed by his son Thomas Mielke. Material is published daily, weekly, monthly, and annually and has to be purchased. I get a lot of information from the (very large) Oil World Annual published around June each year. This provides data on area under cultivation, production, yields, exports, imports, crushing, and disappearance for 17 commodities generally over a five-year period for oilseeds, oils and fats, and oilmeals. Information is provided for the whole world and for over 150 individual countries. In addition there are periodical publications on individual countries such as China and India, on products such as biodiesel, and reviews looking back and forward such as Oil World 2020 (published 2002) providing information from 1975 with forecasts to 2020. An earlier Oil World publication in 1988 covered the period 1958–2007.
Table 1 shows predictions made in 1988 and in 2002 along with the outcome in selected years between 1990 and 2005. It is interesting to note that predictions have been too conservative and that over the period covered in the Table production has run ahead of forecasts. Further comment is made in the legend to the Table.
| Table 1. Production (million tonnes) of 17 commodity oils and fats forecast in 1988 and in 2002 for five-year periods compared with actual figures for selected years (figures are taken from appropriate Oil World publications) | |||||
| Forecast made in 1988 | Forecast made in 2002 | Actual figures | |||
| Years | Production | Years | Production | Years | Production |
| 88-92 | 80.7 | 86-90 | 75.7 | 1990 | 80.1 |
| 93-97 | 92.3 | 91-95 | 86.8 | 1995 | 94.4 |
| 98-02 | 105.3 | 95-00 | 105.1 | 2000 | 114.7 |
| 03-07 | 116.4 | 01-05 | 126.5 | 2005 | 141.0 |
| 06-10 | 146.7 | ||||
| 11-15 | 165.7 | ||||
| 16-20 | 184.8 | ||||
| As a first approximation average figures for a five-year period can be taken as roughly the same as the production in the middle year. So the 1988 prediction for 2003-07 will correspond to a figure of about 116.4 million tonnes for 2005. This is to be compared with the outcome of 141 million tonnes. From the 2002 forecast a figure of about 147 million tonnes is predicted for 2008 and short of the production level in that year of 160 million tonnes. |
|||||
USDA figures. A second source of useful information is provided by the United States Department of Agriculture (USDA). This is revised each month and is free. Put "USDA-FAS" into Google and follow directions for “oilseeds”. The information is for 7 oilseeds, 9 vegetable oils, and 8 oil meals. It includes production, trade (imports and exports), consumption by commodity and by selected countries/regions, and prices.
Commodity Oils and Fats
Oils and fats differ only in that the former are liquid at ambient temperatures and the latter are solid. The term butter is applied to some solid tropical vegetable fats such as cocoa butter and shea butter. The term commodity is applied in an arbitrary manner to those materials produced in sufficient quantity to be of interest to market analysts.
| Table 1. Commodities detailed in the USDA and Oil World sources | ||
| USDA | Oil World additional | |
| Oilseeds | copra, cottonseed, palmkernel, peanut, rapeseed, soybean, sunflower seed [7] | castor, linseed, sesame [10] |
| Oils & fats | coconut, cottonseed, palmkernel, peanut, rapeseed, soybean, sunflowerseed [9] | castor, corn, linseed, sesame, butter, fish, lard, tallow [17] |
| Oil meals | copra, cottonseed, fish, palmkernel, peanut, rapeseed, soybean, sunflower seed [8] | corngerm, corngluten, linseed, sesame [12] |
| Copra is dried coconut flesh and is the source of coconut oil. Peanut is also known as groundnut. Limited data are also provided by Oil World for safflower seed and oil and for tung oil. Data for other important commodities are not given in these sources and information has to be sought elsewhere. They include for example: cocoa butter, rice bran oil, jatropha oil, camelina oil, shea and other fats used as cocoa butter equivalents (CBE), evening primrose and borage oils, and oil from microbial sources. |
||
These are products of the agricultural industry covering fields/plantations, animal husbandry and rendering, and forestry. It is useful to divide this range of products in a number of ways.
- The majority are of plant origin, though the four animal fats (~25 million tonnes in 2009/10) still provide almost 15% of the total oils and fats detailed in Oil World.
- Annuals should be distinguished from tree crops such as the products of the oil palm and the olive. The trees have to be planted and usually take a few years to come to maturity. Oil palms are profitable for 20-30 years but then should be replaced by new trees. Harvesting is a manual operation and presents difficulties with high trees. The olive has a longer profitable life. Decisions about such tree crops are made infrequently. With annuals (e.g. soybean, rapeseed, sunflower) farmers have to make a decision each year depending on agricultural factors such as healthy rotation and on their perception of profitability in comparison to other crops, which may be other oilseeds or cereals such as wheat. In favoured places it may even be possible to have two crops in one season. A response to oversupply or undersupply is more quickly achieved through annuals (to plant or not to plant?) than through tree crops (to fertilise and/or irrigate or not?).
- Another important distinction in relation to controlling supply is to distinguish major products from by-products and to recognise co-products. Examples are given in the Table below. For by-products the amount of oil produced is not dependent on the oils and fats market but on some other commodity.
| Table 2. Commodity oils and fats divided into products, co-products, and by-products | ||
| Products | Co-products | By-products |
| Rapeseed oil | Soybean (oil and meal) | Lard (pig meat) |
| Sunflower oil | Palm oil and palmkernel oil | Tallow (beef) |
| Olive oil | Butter and milk | Fish oil (fish meal) |
| Linseed oil | Cottonseed oil (cotton) | |
| Castor oil | Corn oil (corn) | |
| Sesame oil | ||
| Groundnut | ||
| Coconut oil | ||
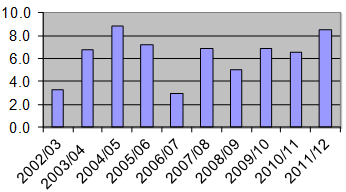
The supply of oils and fats is dominated by four sources and it is these above all other that will be changed most to meet shifting demand. These are palm (and palmkernel), soybean, rapeseed (canola), and sunflower oils. Figure 1 below shows how over the 10-year period (2002/2003 to 2011/12) world production of 9 vegetable oils has increased year-on-year. The average annual increase over these ten years has been 6.3 million tonnes. The annual increase over 10 years (and more) has been built into expectations with the consequence that small rises lead to a bull market with higher prices and consequent concern by consumers, particularly the poorer ones. In contrast, large increases produce a bear market with producers concerned about oversupply and falling prices looking for new uses of oils and fats.
Figure 1. Annual increases (million tonnes) in production of nine vegetable oils from 2002/2003 to 2011/12.
Oilseeds, Oils and Fats, and Seed Meals in 2011/12
Individual products are detailed in other sections, but it is useful to have an overall view of the size of these commodities (see Table 1). The astute reader will be able to draw many conclusions from these data. Some points that interest me are discussed below. Figures are generally given for harvest years such as 2011/12. This relates to harvests in the Northern Hemisphere in 2011 and in the Southern Hemisphere in 2012. We are now in the incomplete 2012/13 harvest year for which forecasts are available. Figures for the recent past may be changed slightly as more reliable data become available. It is no small task to obtain the required data, especially from less developed countries.
| Production of oilseeds, oils and fats, and oilmeals in 2011/12 and ten years earlier using USDA figures (Feb. 2013). Data are expressed in million tonnes (mt) |
|||||||||
| 2001-2002 | 2011-2012 | ||||||||
|---|---|---|---|---|---|---|---|---|---|
| Seeds | Oil | Meal | Seeds | Oil | Meal | ||||
| Soya | 184.8 | 28.9 | 124.9 | 238.7 | 42.4 | 179.4 | |||
| Cotton | 46.6 | 5.3 | 15.8 | ||||||
| Peanut (a) | 35.3 | 5.1 | 6.2 | ||||||
| Sunflower | 21.4 | 7.4 | 8.3 | 33.5 | 15.1 | 13.1 | |||
| Rape (canola) | 36.0 | 13.1 | 19.9 | 61.6 | 24.3 | 35.8 | |||
| Palmkernel | 13.3 | 5.9 | 7.0 | ||||||
| Copra/coconut | 3.2 | 5.5 | 3.6 | 1.9 | |||||
| Olive | 3.4 | ||||||||
| Palm | 25.3 | 50.7 | |||||||
| Fish | 5.8 | 4.5 | |||||||
| Total production | 324.7 | 92.7 | 182.5 | 441.7 | 155.7 | 266.7 | |||
| Total exports | 62.4 | 33.0 | 52.9 | 109.6.9 | 63.5 | 80.9 | |||
|
(a) Also known as groundnut |
|||||||||
USDA do not provide data for corn oil (~2.5 mt), sesame oil, linseed oil, and castor oil (each between 0.5 and 1.0 mt, nor for butter (~7 mt), lard (~8 mt), tallow (~9 mt), and fish oil (~1 mt).
- Figures for seeds and meals are dominated by soybeans. Soya beans, grown mainly in North and South America, are the most important source of protein meal used mainly for animal feed and the second largest source of oil after palm oil. In 2011/12, Ttese two oils represented 60% of the nine major vegetable oils detailed by USDA compared with 58% ten years ago.
- The nine vegetable oils can be categorised as listed below with the figures being total production (million tonnes) in 2011/12 and % of total vegetable oil production (155.7 million tonnes).
- Four major vegetable oils (palm, soybean, rape, and sunflower) 132.5 mt, 85.1%.
- Three minor oils (cotton, groundnut, olive) 13.8 mt, 8.9%.
- Two lauric oils (palmkernel and coconut), distinguished from other oils by their characteristic fatty acid composition 9.5 mt, 6.1%.
- In round figures exports represent about 25% of seeds, 41% of oils, and 30% of oil meals.
- Comparing figures over the ten years between 2001/02 and 2011/12, it is apparent that total production of vegetable oils increased by 68%. The reader can make similar calculations for individual oils and for oilseeds and oil meals from the figures provided in Table 1. For example, production of palm oil doubled over this period.