Parallel Mass Spectrometry (APCI-MS and ESI-MS) for Lipid Analysis
The Author: Wm. Craig Byrdwell, USDA, ARS, BHNRC, FCL, Beltsville, MD 20904, USA
Introduction
Small lipids, such as fatty acids, are typically analyzed in the gas phase. They are usually made volatile by derivatization (i.e. fatty acid methyl esters (FAME); 3-pyridylcarbinol [“picolinyl”] esters and others) for analysis by gas chromatography followed by detection using a flame ionization detector (FID) or mass spectrometry (MS).
Larger lipids, such as intact triacylglycerols (TAGs) and phospholipids, are nonvolatile, and are most commonly analyzed in the liquid phase, by liquid chromatography (LC) with detection using an evaporative light scattering detector (ELSD), a corona charged aerosol detector (CAD), or mass spectrometry. Of course, large lipids can be broken down to smaller, volatile sub-units, typically by acid- or base-catalyzed transesterification. However, when lipids such as TAGs are broken down, important structural information is lost, such as the specific locations of the fatty acyl chains on the glycerol backbone. TAGs that have fatty acids located on specific locations, designated by the stereochemical numbering (sn) system as sn-1, sn-2, and sn-3 on the glycerol backbone, are called stereoisomers (regioisomers do not distinguish positions sn-1 and sn-3). To preserve the structures of the intact molecules and their stereospecificity, they are best analyzed using high-performance liquid chromatography (HPLC), or ultra-high-performance liquid chromatography (UHPLC), coupled with mass spectrometry.
Coupling the condensed phase of HPLC with the high vacuum necessary for ion analysis in a mass spectrometer requires quickly evaporating large amounts of liquid mobile phase to release analyte molecules into the gas phase, along with ionization of those molecules, so they can be detected by the mass filtering device. This is usually done by spraying the effluent stream with concentric gas (often nitrogen) in the process called nebulization (Fig. 1). The processes of nebulization and ionization usually occur at atmospheric pressure, and thus the formation of ions under these conditions is called “atmospheric pressure ionization” (API).
Figure 1. Ionization process occurring in the APCI source. (Figure adapted from Ref. [2] with the permission of AOCS Press)
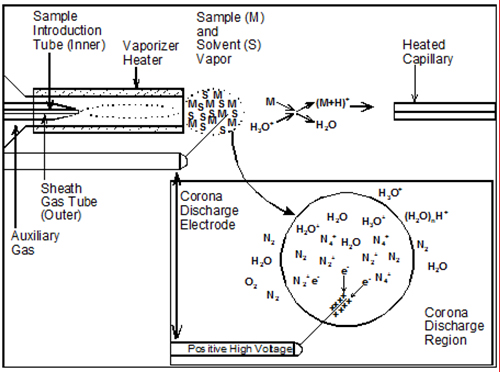
The three most commonly used API techniques are atmospheric pressure chemical ionization (APCI), electrospray ionization (ESI), and atmospheric pressure photoionization (APPI). Both APCI and APPI start by spraying the nebulized solvent/analyte mixture down a heated vaporizer tube to aid in desolvation, and the vaporized mist passes by either a corona discharge needle held at high voltage (~2-5 kV), in the case of APCI, or a strong UV lamp that emits photons in the 10-11 eV range, in the case of APPI. The APPI source used by most mass spectrometer manufacturers today uses a Kr vacuum UV lamp giving off photons having energies of 10.0 and 10.6 eV. This is lower energy than the ionization energies of many common LC solvents (so they are not ionized), but it is higher energy than the ionization energy of acetone and toluene, which are added as ‘dopants’ to form ions that transfer their charges to analyte molecules. The dopant is usually added either to the mobile phase, to the ionization source via a ‘sheath liquid’ connection, or via a tee immediately prior to the liquid inlet fitting of the ionization source. As might be expected, the nature of the solvents used in the LC mobile phase has a substantial effect on the ability of the dopant to ionize analyte molecules [1].
Electrospray ionization that uses a concentric nebulization gas to assist desolvation is technically referred to as pneumatically assisted electrospray ionization to differentiate it from conventional ESI, which uses only charging of the liquid to accomplish nebulization. But in practice, modern ESI sources all include a nebulizing gas, and these are simply referred to as ESI. Most modern ESI sources also include the capability to provide heat to assist in desolvation, which allows even higher flow rates to be used than pneumatically assisted ones.
All three of these common API sources provide ‘soft’ ionization of molecules, usually with a protonated molecule or molecular adduct ion, and a few large fragments. However, the relative proportions of the intact protonated molecule and adduct ions versus the fragments distinguishes ESI from APCI, and is the reason that the data from these techniques are complementary and both are valuable and desirable. APPI gives spectra very similar to APCI spectra, so the discussion of APCI applies equally well to APPI.
ESI almost always produces an intact molecule ion, [M+H]+ (not to be confused with a ‘molecular ion’, which is an odd-electron species formed by loss or addition of an electron only), or adduct ion, [M+X]+ (X = Li, Na, NH4, etc.), and only small abundances of fragments, unless MS/MS is applied. While phospholipids are naturally amenable to ESI, triacylglycerols normally require addition of an electrolyte, such as ammonium formate or ammonium acetate, to produce adduct ions, [M+NH4]+, (i.e. ammonium ions in this example). Lithium adducts, [M+Li]+, are another popular adduct for ESI-MS of TAGs, due to the ease of regioisomer identification and potential for double bond localization by ESI-MS/MS of these adducts [3].
APCI and APPI, on the other hand, produce substantial diacylglycerol-like fragment ions, [DAG]+, and, in the case of TAGs, the amount of protonated molecule formed depends greatly on the degree of unsaturation in the molecule. Polyunsaturated TAGs produce an [M+H]+ base peak, while saturated TAGs often yield little or no [M+H]+ ion. Thus, for saturated TAGs, intact molecule adduct ions obtained by ESI-MS can be a valuable complement to the diacylglycerol-like fragment ions, [DAG]+, seen in APCI-MS data. Conversely, the ratio of [DAG]+ fragments produced by APCI-MS is indicative of the composition of regioisomers, whereas ESI-MS of regioisomers is less clear. For these and other reasons discussed below, acquisition of both ESI-MS and APCI-MS is desirable.
Acquisition of ESI-MS and APCI-MS data can be accomplished using a single mass spectrometer, by performing one type of analysis and then changing ionization sources and re-analyzing the same sample. There are numerous reports in the literature that use this approach to compare results from these popular API interfaces. But this is time consuming and requires twice as many resources (solvents, gases, time, etc.) as a single run. An obvious alternative is to acquire both types of data simultaneously, using a multiple parallel mass spectrometry approach.
Results
We first conducted APCI-MS and ESI-MS in parallel simultaneously (so-called ‘dual parallel mass spectrometry’) well over a decade ago [4], and multiple parallel mass spectrometry has now become our default mode of operation. We have improved on dual parallel mass spectrometry and now routinely perform triple parallel mass spectrometry [5] and even quadruple parallel mass spectrometry as a matter of course. Typical data from a triple parallel mass spectrometry experiment [5] are given in Figures 2, 3, and 4. Figure 2 shows the APCI-MS analysis of vitamin D and triacylglycerols using a QTrap 5500 hybrid mass spectrometer. This mass spectrometer was used for selected ion monitoring (SIM) MS, selected reaction monitoring (SRM) MS, and full-scan MS for vitamin D (see Ref. [5]). Typical APCI-MS mass spectra of dilinoleoyloleoylglycerol (LLO) and dioleoylpalmitoylglycerol (OOP) are shown in Figures 2B and 2C, respectively. Figure 3 shows a chromatogram and mass spectra obtained in parallel by ESI-MS on an ion trap instrument. The secosterol analyte molecules did not give signals above the limit of detection by ESI-MS (Fig. 3B). Figure 4 shows a chromatogram and APCI-MS mass spectra on the older TSQ 7000 instrument, also acquired simultaneously in parallel. Although this instrument showed peaks for vitamin D (see Ref. [5]), the S/N was not nearly as high as was observed on the newer, more sensitive QTrap 5500, making the latter instrument the better choice for quantification of vitamin D.
Figure 2. (A) QTrap 5500 APCI-MS total ion current chromatogram (TIC) of ________; (B) APCI-MS mass spectrum of a TAG consisting of LLO; (C) APCI-MS mass spectrum of OOP. See TAG peak identities in Ref. [5].
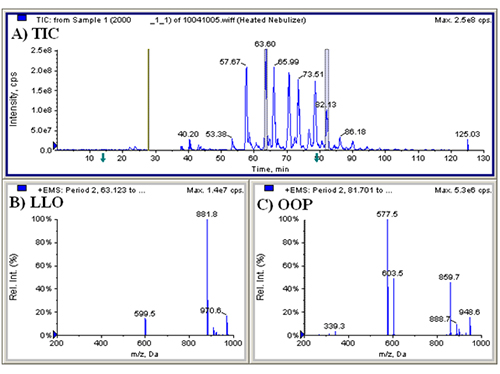
Figure 3. (A) LCQ Deca XP ESI-MS total ion current chromatogram (TIC) of ______; (B) extracted ion chromatogram of m/z 365-420; (C) ESI-MS mass spectrum of LLO; (D) ESI-MS mass spectrum of OOP. See TAG peak identities in Ref. [5].
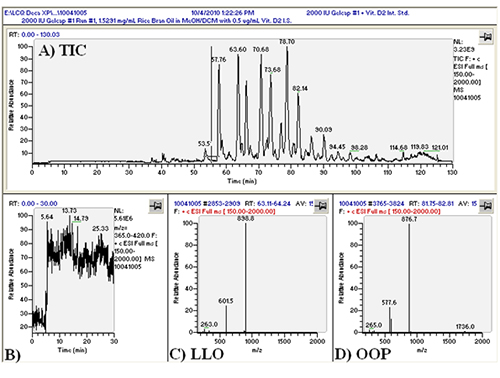
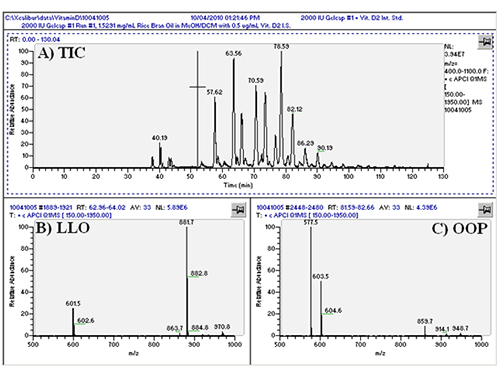
Figure 4. TSQ 7000 APCI-MS chromatogram and mass spectra. (A) Total ion current chromatogram (TIC) of _____; (B) APCI-MS mass spectrum of LLO; (C) APCI-MS mass spectrum of OOP. See TAG peak identities in Ref. [5].
The extremely high sensitivity of the QTrap 5500, which made it so valuable for analysis of the low levels of vitamin D in the dietary supplements, presented a problem for triacylglycerol analysis in the same sample. The TAGs were present at levels that were orders of magnitude higher than the vitamin D analytes. This led to nonlinear responses to the most abundant TAGs present in the dietary supplement base oil, and can lead to shifting of the assigned mass by as much as 0.4 Da in mass spectra from this instrument. Thus, while this highly sensitive instrument was ideal for quantification of components present at low levels, its sensitivity led to problems with quantification of the bulk sample that was present in much higher amounts. Of course, one solution would be to dilute the sample until even the major components were within the quantification dynamic range of the sensitive instrument. But this would have several undesirable side effects, including giving a poorer S/N for the analytes present at low levels (vitamin D) and reducing the signal coming from the two-dimensional auxiliary detectors, the corona CAD and the ELSD. Both of these detectors were far less sensitive than the QTrap 5500, so further reducing the sample concentration could easily lead to loss of peaks in the auxiliary detector chromatograms. Similarly, it would lead to diminished signal for the other parallel mass spectrometers.
Therefore, we used an older, less sensitive mass spectrometer for APCI-MS of the TAGs in the bulk oil, in parallel with the more sensitive instrument used for vitamin D analysis. Thus, dramatic differences in concentrations of molecules of interest (vitamin D versus TAGs) are another important reason to employ multiple mass spectrometers in parallel, even if the mass spectrometers use the same type of ionization (i.e. APCI-MS).
Of course, use of the QTrap 5500 APCI-MS data for qualitative confirmation of unusual species identified using the TSQ 7000 APCI-MS and LCQ Deca XP ESI-MS instruments makes acquisition of QTrap APCI-MS data after the elution of the vitamin D analytes useful nonetheless.
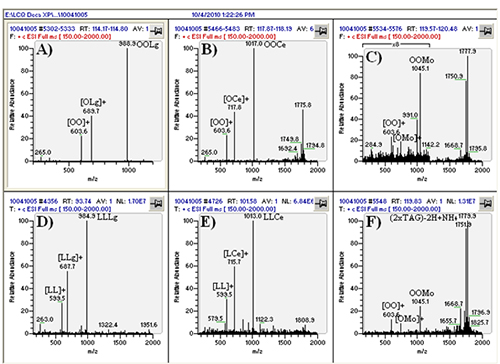
The real value of the multiple parallel mass spectrometry arrangement becomes apparent by comparing the mass spectrum in Figure 3D to that in Figure 4C. The TAG OOP has only two sites of unsaturation, so by APCI-MS it produces only a relatively small protonated molecule peak, [M+H]+. However, by ESI-MS this and all other TAGs produce an ammonium adduct, [M+NH4]+, as the most prominent peak (base peak) in all mass spectra. The difference is even more dramatic in the case of saturated TAGs, which produce virtually no [M+H]+ by APCI-MS, but give an [M+NH4]+ base peak by ESI-MS. This becomes especially important in cases of chromatographic overlap of species, or identification of new or rarely reported TAGs with little or no unsaturation, in which MS/MS of the [M+NH4]+ precursor ion can be definitive for proof of TAG identity. This is demonstrated in Figure 5, which shows TAGs containing very-long-chain fatty acids (VLCFA), including lignoceric (24:0), cerotic (26:0), and montanic (28:0) fatty acids. By APCI-MS, a TAG such as dioleoylmontanoyl triacylglycerol (OOMo) produces only a small protonated molecule ion, which may not rise above the level of noise. But by ESI-MS, this TAG and similar TAGs produced an [M+NH4]+ as the largest TAG peaks. However, these TAGs did not fragment well in the ion trap to give definitive MS/MS spectra, so the fragments in the APCI-MS spectra at the corresponding time provided confirmation of the unusual identities.
Figure 5. ESI-MS spectra of TAGs containing VLCFAs, from 24:0 to 28:0. (A) to (C) represent average mass spectra across peaks in Figure 3. (D) to (F) are individual mass spectra. TAG identities labeled next to [M+NH4]+ ions. Peak retention times can be seen in each frame.
This correlation points out another important benefit of a multiple parallel mass spectrometry approach. Since mass spectra are acquired simultaneously from the same eluent, the times in the different chromatograms are either identical or have a small fixed offset, dictated by the lengths of tubing going to each instrument. This completely eliminates any uncertainty associated with run-to-run variability between chromatograms that are run separately in sequence. This can be of crucial importance when dealing with species present at very low levels that are hard to identify. Any uncertainty that can be eliminated adds confidence to structural assignments proposed using complementary ionization techniques.
Another benefit to using multiple ionization techniques in parallel is the fact that some molecules respond better to some ionization methods than others. This was pointed out above, by the fact that vitamin D does not respond well by ESI-MS but gives good response to APCI-MS. Conversely, high molecular weight TAG oxidation products (TAGOX), formed by the cross-linking of oxidation product monomers, were readily observed by ESI-MS, but produced little or no signal by APCI-MS. Although dimers (2 x TAGOX) can be seen by APCI-MS, trimers (3 x TAGOX) and tetramers (4 x TAGOX) do not give intact molecules by APCI-MS. However, by ESI-MS these oligomers produce intact [M+NH4]+ adducts that allow very sensitive analysis of this class of fairly large molecules. As an example, the ions in the range m/z 1700-1800 in Figure 5 represent dimers of 16:0- and 18:0-carbon-containing TAGOX that readily formed abundant ammonium adducts.
Conclusion
Different atmospheric pressure ionization sources produce different balances between intact molecule ions and fragments. That balance between intact ions and fragments obtained by APCI-MS is greatly affected by the degree of unsaturation in TAGs. While the fragments can provide important structural information, including the composition of regioisomers, the intact molecule ion is very important for molecular weight determination and confirmation of the structure deduced from fragments. As the data above have shown, having both ESI-MS and APCI-MS is valuable for structure elucidation. There are also plenty of cases where a class of molecules does not respond well to one type of ionization but exhibits abundant signal using another type of ionization. In such cases, using different ionization types simultaneously can mean the difference between detecting and not detecting target molecules.
While the data above, and that in the literature, have, one hopes, proven the value of multiple parallel mass spectrometry, there is still the hurdle of logistics to overcome to implement such a seemingly complex arrangement of instruments. Some of the first barriers to overcome are the preconceptions that such a system is either prohibitively expensive or very difficult to implement.
The use of multiple parallel mass spectrometers does not require a substantial capital outlay. Implementation can be the result of natural upgrading and replacing instruments during the normal lifetime of a lab. At some point, most labs upgrade older instruments to take advantage of the improved sensitivity and ease of operation of current-generation instruments. In such cases it is very straightforward to keep the older instrument in service, acting as an auxiliary detector to the newer instrument. As demonstrated above, it can even be very beneficial to keep an older, less sensitive instrument in service for analysis of bulk samples, while newer, more sensitive instruments are required to meet the demands of analysis of targets present at very low levels. Older mass spectrometers are often more compatible with the concentration ranges required for two-dimensional auxiliary detectors, such as the corona CAD and ELSD. Furthermore, the proliferation of used instrument suppliers has made acquisition of mass spectrometers as auxiliary detectors more feasible than ever (two of the instruments used for this article were purchased used, while one was purchased new).
Finally, it is necessary to address the logistics of implementing a multiple parallel mass spectrometry arrangement. Virtually all autosamplers that are part of LC systems today have contact closure outputs that are used to start external instruments, and the vast majority of instruments of various types (MS, UV, CAD, ELSD) include a contact closure input to initiate data acquisition. The contact closures from LC systems can be input into a central ‘manifold’ that can distribute those start signals to various instruments. Figure 6 shows the start signal distribution panel constructed in our laboratory from cheap parts and switches available from a local electronics store. LC contact closures come into the two switches on the left side of the photo and are distributed to whichever instruments are selected via the remaining switches. One LC system can even start another LC system by directing the contact closure output of one autosampler to the input of a second LC system. None of this requires advance knowledge of electronics and circuitry, but rather simple wiring that any determined novice can accomplish.
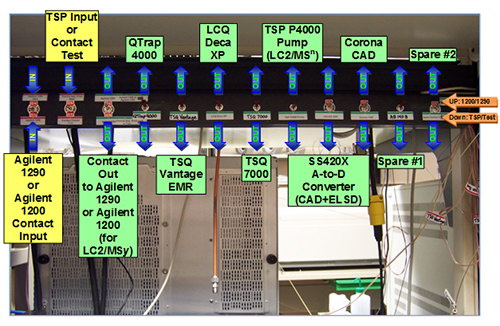
Figure 6. Switching panel for selection of LC inputs and outputs to mass spectrometers, other detectors, and other LCs for LC1/MS1 to LC3/MS4 experiments.
Thus, the logistics of implementing a multiple parallel mass spectrometry system are not arduous. The reward makes the effort well worthwhile, because the quality of the data produced and the certainty with which targets can be qualitatively determined and quantified is greater than that obtained from a single instrument alone, or from multiple runs performed sequentially. Plus, there is a great deal of satisfaction that comes from seeing a room full of instruments spring to life from the touch of a single start button, in a symphony of data acquisition.
References
- Cai, S.S., Short, L.C., Syage, J.A., Potvin, M. and Curtis, J.M. Liquid chromatography-atmospheric pressure photoionization-mass spectrometry analysis of triacylglycerol lipids-Effects of mobile phases on sensitivity. J. Chromatogr. A, 1173, 88-97 (2007) (DOI: 10.1016/j.chroma.2007.10.008).
- Byrdwell, W.C. Qualitative and quantitative analysis of triacylglycerols by atmospheric pressure ionization (APCI and ESI) mass spectrometry techniques. In: Modern Methods for Lipid Analysis by Liquid Chromatography/Mass Spectrometry and Related Techniques, pp. 298-412 (W.C. Byrdwell, AOCS Press, Champaign, IL) (2005).
- Hsu, F.F. and Turk, J. Electrospray ionization multiple-stage linear ion-trap mass spectrometry for structural elucidation of triacylglycerols: Assignment of fatty acyl groups on the glycerol backbone and location of double bonds. J. Am. Soc. Mass Spectrom., 21, 657-669 (2010) (DOI: 10.1016/j.jasms.2010.01.007).
- Byrdwell, W.C. Dual parallel mass spectrometers for analysis of sphingolipid, glycerophospholipid and plasmalogen molecular species. Rapid Commun. Mass Spectrom., 12, 256-272 (1998) (DOI: 10.1002/(SICI)1097-0231(19980314)12:53.0.CO;2-8).
- Byrdwell, W.C. "Dilute-and-shoot" triple parallel mass spectrometry method for analysis of vitamin D and triacylglycerols in dietary supplements, Anal. Bioanal. Chem., 401, 3317-3334 (2011) (DOI: 10.1007/s00216-011-5406-4).
Suggested Further Reading
- Byrdwell,W.C. Multiple parallel mass spectrometry techniques for lipid and vitamin D analysis. In: Extreme Chromatography: Faster, Hotter, Smaller, pp. 255-299 (W.C. Byrdwell and M. Holcapek, eds., AOCS Press, Urbana, IL.) (2011).
- Byrdwell, W.C. Dual parallel mass spectrometry for lipid and vitamin D analysis. J. Chromatogr. A, 1217, 3992-4003 (2010) (DOI: 10.1016/j.chroma.2009.11.101).
- Byrdwell, W.C. Dual parallel liquid chromatography/mass spectrometry for lipid analysis. In: Modern Methods for Lipid Analysis by Liquid Chromatography/Mass Spectrometry and Related Techniques, pp. 510-576 (W.C. Byrdwell, ed., AOCS Press, Champaign, IL.) (2005).