Shotgun Lipidomics
The Author: Xianlin Han, Programs of Cardiovascular Metabolism and Integrative Metabolism, Center for Metabolic Origins of Disease, Sanford Burnham Prebys Medical Discovery Institute, Orlando, Florida, USA
Lipidomics, as a newly emerged research discipline which studies lipids in a systems biology approach based on the techniques and principles of analytical chemistry [1,2], is rapidly expanding [3-5]. Mass spectrometric analysis of lipids plays a key role in the field [6]. There exist two major complementary approaches in mass spectrometric analysis of lipids in lipidomics. One has been developed after direct infusion, which has been called ‘shotgun lipidomics’, while the other uses liquid chromatographic separations prior to mass spectrometric analysis. Shotgun lipidomics exploits the chemical and physical properties of lipids to facilitate the high-throughput global analysis of a cellular lipidome directly from organic extracts of biological samples [7,8].
A major advantage of shotgun lipidomics over LC-MS analysis of lipids is that a mass spectrum displaying molecular ions of individual molecular species of a lipid class of interest can be acquired at a constant concentration of the solution during direct infusion. This unique feature allows researchers to perform precursor-ion scans of the particular fragment ions and/or neutral loss scans of the neutrally lost fragments of interest on the individual molecular species of a lipid class or a category of lipid classes for their identification and quantification without the time constraints typically encountered through “on the fly” analysis during chromatographic elution. Each suite of scans determines the identity of the molecular ion by recognizing that the majority of lipid species represent linear combinations of a handful of building blocks [7,8]. Typical building blocks include glycerol, sphingoid bases, polar head groups, and fatty acyl substituents (or other aliphatic chains).
There are at least three different platforms of shotgun lipidomics in practice that include the following.
Profiling of Molecular Species of a Lipid Class by Scanning a Characteristic Fragment Diagnostic of the Class
Each of the most common lipid classes contains one or more characteristic fragments after collision-induced dissociation, which can be used to determine the presence of individual molecular species of the class through precursor-ion or neutral loss scanning or both after direct infusion. Based on characteristic precursor-ion or neutral loss scan(s), a method for quantitative analyses of these lipid classes after ESI has been developed [10,11]. In this platform, at least two molecular species of a lipid class of interest need to be added as internal standards to the lipid extracts during extraction of biological samples as described [12]. These internal standards are used to correct multiple experimental factors for accurate quantification. The selection of these internal standards should consider at least two criteria: (1) these compounds should be absent or present in minimal amounts in the original lipid extracts; and (2) these compounds should faithfully represent the physical properties (e.g., acyl chain length and unsaturation) of the examined lipid class. Then, a tandem mass spectrometric analysis in either neutral loss or precursor-ion mode can be performed to detect and quantify the individual molecular species of the class in the infused lipid solution. The selected neutral loss or precursor-ion scan should be characteristic of, if not entirely unique to, the lipid class of interest. Owing to the simplicity of this methodology, many research groups have adopted this platform for a variety of applications [13-16].
Identification and Quantification of Individual Lipid Molecular Species by Shotgun Lipidomics Using Tandem Mass Spectrometry
This method employs high mass accuracy/high mass resolution mass spectrometers, particularly the quadrupole-time-of-flight type of instrument [17-21]. By using this methodology, a product ion spectrum of each molecular ion in a unit mass after direct infusion can be rapidly and efficiently acquired [18]. After performing product ion analyses of molecular ions within a mass range of interest, any precursor-ion scans and/or neutral loss scans of interest can be extracted from the acquired product ion spectra. The analyses can be conducted in both positive-ion and negative-ion modes in the presence of ammonium acetate in the infused solution [22]. Identification can be performed from bioinformatic reconstruction of the fragments from precursor-ion or neutral loss scans. Quantification can be achieved through comparison of the sum of the intensities of extracted fragments of an ion to that of a pre-selected internal standard.
Identification and Quantification of Individual Lipid Molecular Species by Multidimensional Mass Spectrometry-Based Shotgun Lipidomics (MDMS-SL)
If we hypothetically ramp the neutral loss of all potential fragments or monitor all potential fragment ions unit by unit in a mass range of interest, each of the ramps in mass or mass to charge constitutes a two-dimensional map of the molecular species in the determined mass range. The first dimension is the molecular ions (x-axis) in m/z values, while the second dimension is comprised of the mass corresponding to the neutrally lost fragments in mass value or the monitored fragment ions in m/z values (y-axis). The cross peaks of a given primary molecular ion in the first dimension with the second dimension represent the fragments of a given molecular ion, a pseudo product ion spectrum of the molecular ion. Analysis of these cross peaks (i.e., the individual fragments) thereby identifies the structure of the given molecular ion as well as its isobaric substituents [23]. These kinds of two-dimensional maps have been referred to as two-dimensional mass spectrometry (2D MS) by Han and Gross [23-25], since they are entirely analogous to two-dimensional NMR spectroscopy. The only difference between these two-dimensional approaches is that the former uses units in the mass domain while the latter uses units in the frequency domain. Since naturally occurring lipids are comprised of known building blocks, this process is readily simplified by monitoring only those building blocks that are characteristic of individual molecular species of a lipid class of interest (i.e. building blocks of the class of interest). In this simplified 2D MS, the y-axis represents the building blocks of a lipid class or a category of lipid classes. Individual lipid molecular species of a class of interest by 2D MS can be automatically identified [7,8].
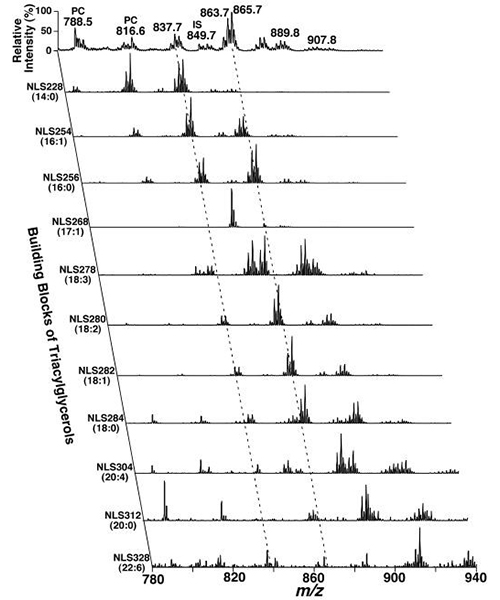
For example, the building blocks of triacylglycerols are the three acyl chains. There are approximately ten common fatty acids in nature. Characterization of lithiated triacylglycerols demonstrates that these acyl chains can be determined by neutral loss of the fatty acids corresponding to the acyl chains [24]. All the neutral loss scans together with the full scan acquired from the human plasma sample constitute a two-dimensional spectrum (Fig. 1). Analysis of the cross peaks between the lithiated triacylglycerol species in the full scan and its corresponding building blocks in the second dimension allows identification of individual species including those that are isomeric in fatty acyl chain length, but not in double bond locations and in regio-positions. For example, the primary ion at m/z 837.7 is crossed with the 14:0, 16:0, 16:1, 18:0, 18:1, and 18:2 fatty acyl building blocks (see the left broken line in Fig. 1). A lithiated triacylglycerol species at m/z 837.7 must contain 53 total carbon atoms with 2 double bonds or 54 total carbon atoms with 9 double bonds, and the ion intensities resulting from the neutral loss of the three acyl chains from a given triacylglycerol molecule are nearly equal. Thus, isomeric triacylglycerols of 14:0-18:1-18:1, 14:0-18:0-18:2, 16:0-16:0-18:2, and 16:0-16:1-18:1 can be identified. Other triacylglycerols corresponding to other primary ions can be identified similarly.
Figure 1. Representative two-dimensional MS analyses of triacylglycerols in a lipid extract of a human plasma sample. Neutral loss scans (NLS) of all naturally occurring aliphatic chains (i.e. the building blocks of triacylglycerols) of a human plasma chloroform extract were utilized to determine the identities of each molecular ion, deconvolute isomeric species, and quantify individual triacylglycerol by comparisons with a selected internal standard (i.e. T17:1 triacylglycerol, shown in NLS268). Collision activation was carried out with collision energy of 32 eV and gas pressure of 1 mTorr on a triple quadrupole mass spectrometer (TSQ Quantum Ultra Plus, ThermoFisher Scientific, San Jose, CA). All displayed mass spectral traces are normalized to the base peak in each trace.
Quantification of the identified individual molecular species of a class of interest is performed in a two-step procedure as outlined previously [26]. Specifically, the molecular species of the class of interest that are abundant and not overlapping with species in any other classes are quantified by ratiometric comparison with the selected internal standard of the class by using a full MS scan. Then, some or all of these quantified molecular species plus the original internal standard are employed as standards to quantify other low-abundance and/or overlapped molecular species in the class by using one or more class-specific precursor-ion scans and/or neutral loss scans. By using this two-step methodology, the dynamic range of quantitation can be increased by at least two orders of magnitude as previously demonstrated [27]. In theory, to investigate extensively the effects of ionization conditions on ionization efficiency and/or the effects of collision conditions on fragmentation processes, a variety of ionization voltages, ionization temperatures, collision energies, collision gas pressures, etc. should be employed in a particular experiment. These variables can all be ramped within a certain range. Therefore, each of these variables constitutes an additional dimension to the mass ramp dimension described above. All these dimensions form the family of multidimensional MS [23].
References
- Han, X. and Gross, R.W. Global analyses of cellular lipidomes directly from crude extracts of biological samples by ESI mass spectrometry: a bridge to lipidomics. J. Lipid Res., 44, 1071-1079 (2003).
- Wenk, M.R. The emerging field of lipidomics. Nat. Rev. Drug Discov., 4, 594-610 (2005).
- Christie, W.W. and Han, X. Lipid Analysis - Isolation, Separation, Identification and Lipidomic Analysis (4th edition), 446 pages (Oily Press, Bridgwater, U.K.) (2010).
- Dennis, E.A. Lipidomics joins the omics evolution. Proc. Natl. Acad. Sci. U.S.A., 106, 2089-2090 (2009).
- Han, X. Lipidomics: Comprehensive Mass Spectrometry of Lipids, 496 pages (Wiley, Hoboken, New Jersey) (2016).
- Ivanova, P.T., Milne, S.B., Myers, D.S. and Brown, H.A. Lipidomics: a mass spectrometry based systems level analysis of cellular lipids. Curr. Opin. Chem. Biol., 13, 526-531 (2009).
- Han, X., Yang, K., and Gross, R.W. Multi-dimensional mass spectrometry-based shotgun lipidomics and novel strategies for lipidomic analyses. Mass Spectrom. Rev., 31, 134-178 (2012).
- Wang, M., Wang, C., Han, R.H., and Han, X. Novel advances in shotgun lipidomics for biology and medicine. Prog. Lipid Res., 61, 83-108 (2016).
- Yang, K., Cheng, H., Gross, R.W. and Han, X. Automated lipid identification and quantification by multi-dimensional mass spectrometry-based shotgun lipidomics. Anal. Chem., 81, 4356–4368 (2009).
- Brugger, B., Erben, G., Sandhoff, R., Wieland, F.T. and Lehmann, W.D. Quantitative analysis of biological membrane lipids at the low picomole level by nano-electrospray ionization tandem mass spectrometry. Proc. Natl. Acad. Sci. U.S.A., 94, 2339-2344 (1997).
- Welti, R. and Wang, X. Lipid species profiling: a high-throughput approach to identify lipid compositional changes and determine the function of genes involved in lipid metabolism and signaling. Curr. Opin. Plant Biol., 7, 337-344 (2004).
- Wang, M., Wang, C., and Han, X. (2016) Selection of internal standards for accurate quantification of complex lipid species in biological extracts by electrospray ionization mass spectrometry – What, how and why? Mass Spectrom. Rev., DOI 10.1002/mas.21492 (2016)
- Postle, A.D., Wilton, D.C., Hunt, A.N. and Attard, G.S. Probing phospholipid dynamics by electrospray ionisation mass spectrometry. Prog. Lipid Res., 46, 200-224 (2007).
- Basconcillo, L.S., Zaheer, R., Finan, T.M. and McCarry, B.E. A shotgun lipidomics approach in Sinorhizobium meliloti as a tool in functional genomics. J. Lipid Res., 50, 1120-1132 (2009).
- Deeley, J.M., Mitchell, T.W., Wei, X., Korth, J., Nealon, J.R., Blanksby, S.J. and Truscott, R.J. Human lens lipids differ markedly from those of commonly used experimental animals. Biochim. Biophys. Acta, 1781, 288-298 (2008).
- Cui, Z. and Thomas, M.J. Phospholipid profiling by tandem mass spectrometry. J Chromatogr. B, 877, 2709-2715 (2009).
- Ekroos, K., Chernushevich, I.V., Simons, K. and Shevchenko, A. Quantitative profiling of phospholipids by multiple precursor ion scanning on a hybrid quadrupole time-of-flight mass spectrometer. Anal. Chem., 74, 941-949 (2002).
- Ejsing, C.S., Duchoslav, E., Sampaio, J., Simons, K., Bonner, R., Thiele, C., Ekroos, K. and Shevchenko, A. Automated identification and quantification of glycerophospholipid molecular species by multiple precursor ion scanning. Anal. Chem., 78, 6202-6214 (2006).
- Schwudke, D., Oegema, J., Burton, L., Entchev, E., Hannich, J.T., Ejsing, C.S., Kurzchalia, T. and Shevchenko, A. Lipid profiling by multiple precursor and neutral loss scanning driven by the data-dependent acquisition. Anal. Chem., 78, 585-595 (2006).
- Schwudke, D., Liebisch, G., Herzog, R., Schmitz, G. and Shevchenko, A. Shotgun lipidomics by tandem mass spectrometry under data-dependent acquisition control. Methods Enzymol., 433, 175-191 (2007).
- Ståhlman, M., Ejsing, C.S., Tarasov, K., Perman, J., Borén, J. and Ekroos, K. High throughput oriented shotgun lipidomics by quadrupole time-of-flight mass spectrometry. J. Chromatogr. B, 877, 2664-2672 (2009).
- Ejsing, C.S., Sampaio, J. L., Surendranath, V., Duchoslav, E., Ekroos, K., Klemm, R.W., Simons, K. and Shevchenko, A. Global analysis of the yeast lipidome by quantitative shotgun mass spectrometry. Proc. Natl. Acad. Sci. U.S.A., 106, 2136-2141 (2009).
- Han, X. and Gross, R.W. Shotgun lipidomics: multi-dimensional mass spectrometric analysis of cellular lipidomes. Expert Rev. Proteomics, 2, 253-264 (2005).
- Han, X. and Gross, R.W. Quantitative analysis and molecular species fingerprinting of triacylglyceride molecular species directly from lipid extracts of biological samples by electrospray ionization tandem mass spectrometry. Anal. Biochem., 295, 88-100 (2001).
- Han, X., Yang, J., Cheng, H., Ye, H. and Gross, R.W. Towards fingerprinting cellular lipidomes directly from biological samples by two-dimensional electrospray ionization mass spectrometry. Anal. Biochem., 330, 317-331 (2004).
- Cheng, H., Jiang, X. and Han, X. Alterations in lipid homeostasis of mouse dorsal root ganglia induced by apolipoprotein E deficiency: A shotgun lipidomics study. J. Neurochem., 101, 57-76 (2007).
- Han, X., Yang, K. and Gross, R.W. Microfluidics-based electrospray ionization enhances intrasource separation of lipid classes and extends identification of individual molecular species through multi-dimensional mass spectrometry: Development of an automated high throughput platform for shotgun lipidomics. Rapid Commun. Mass Spectrom., 22, 2115-2124 (2008).