Development of Gas-Liquid Chromatography
The Author: A.T. James
During the period up to World War II, biochemists and natural product chemists had few good techniques for isolating small amounts of material and for separating closely related substances such as fatty acids/alcohols, etc. Selective precipitation, distillation for volatile substances, crystallization, extraction, etc, were almost useless for the milligram scale and were limited in application. Chemists were in a slightly more favourable position than biochemists in so far that, if chemists had difficulties purifying their material, they could at least make more. Biochemists normally had only milligrams of material to deal with. For these people, the older separation techniques were enormously limiting.
In 1941, that changed.
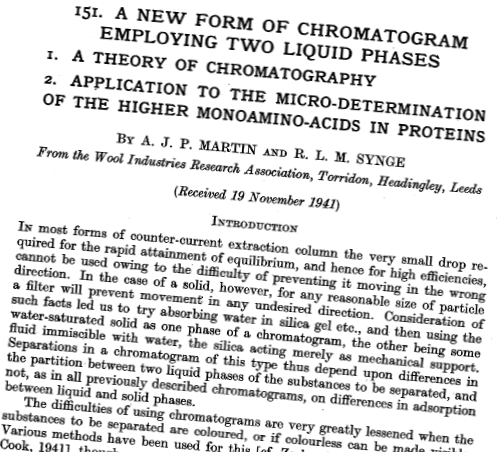
Figure 1 shows the title page of the paper published in 1941 [1] by Martin and Synge from the Wool Industries Research Association. They had met originally at Cambridge. (Cambridge did not think a great deal of A.J.P. Martin – he didn't get a terribly good degree.) Martin had done his Ph.D. there with Sir Charles Martin (no relative) and in fact became the first man to isolate vitamin E, but, as was usual with A.J.P., he never published the work. Martin was therefore interested very early on in separation techniques of biologically derived molecules.
Figure 1. Title page of 1941 paper by Martin and Synge [1}
Martin had created the very first continuous liquid-liquid distribution apparatus for the vitamin E purification. He and Synge got together to apply liquid-liquid distribution to the separation of the amino acids. At that time, the great hope was that, by quantitatively determining amino acids, all the secrets of protein structure and function would be revealed (this was later shown, to say the least, to be somewhat of a simplification). The modified apparatus they designed leaked chloroform at every joint so that the man who was sitting with the apparatus was infernally bad-tempered at the time of takeover so they always quarrelled then. The apparatus did not work as well as hoped because of carryover of both phases, due to lack of equilibration in the settling tubes.
Both men then moved to the Wool Industries Research Association (Leeds, England) where Martin conceived with Synge the idea of holding one liquid phase on the column packing (in this case silica gel) and moving the lesser polar solvent through. With this they were able to quantitatively separate for the first time the aliphatic amino acids as their N-acyl derivatives. This work on the first liquid-liquid chromatograph that really opened up separation technology was published in 1941 [1].
This paper developed the first theoretical plate treatment of a chromatograph and showed the reasons for the high efficiencies obtainable. Martin understood extremely well the physical chemistry behind the whole system. However, the paper also contained the phrase: the mobile phase need not be a liquid but may be a vapour: By mean of this, refined separations may be carried out. This clear indication of a new technique was in the paper in 194l. Now some of you may suffer from the illusion that all you have to do is to point a scientist in the right direction, give him a good idea and then he will take it up. Clearly this was not the case; no one heeded the suggestion.
Now comes a series of coincidences before Martin and I started to work together. In 1949 I had moved from Bedford College for Women, where I was working on antimalarials to the Lister Institute for Preventive Medicine so that I could work with Synge on the structure of the cyclic peptide Gramicidin. At that time scientists were treated rather differently from now as I shall show. I had also applied to the National Institute for Medical Research, then at Hampstead for a position as a biochemist, and had been offered a job to work in Neuberger’s division of biochemistry at the then quite princely sum of £550 a year. Since I was attracted to Synge’s work on Gramicidin, I applied for a job at the Lister Institute. I was, of course, interviewed by Synge and by the director of the institute and I was offered the job. On inquiring as to what the salary was, I was told it was £450 a year. Slightly taken aback by this I foolishly said to the director “Oh, Sir Charles Harrington’s just offered me a job at £550 a year.”
“Oh,” said the director, “We’ll soon fix that,” and in front of me he picked up the phone and harangued Harington for daring to offer me £100 more than he could afford, so Harrington dropped his offer by £100. It was a different world then.
Anyway, I decided I preferred to go and work with Synge and learn the new chromatographic techniques. Synge left after a year or so and moved to the Rowett Institute in Scotland; then A.J.P. Martin arrived to be parked at the Lister Institute while the laboratories at Mill Hill, which had been occupied by the WAAF (Women's Auxiliary Air Force) during the war, were converted into laboratories and Martin’s suite of laboratories was completed. At that time I was working on (as a side issue) attempting a new separation of the amino sugars which W.T.J. Morgan had asked me to do. The two amino sugars of mucopolysaccharides - galactosamine and glucosamine - were separated then by paper chromatography (also invented by A.J.P. Martin), but this was laborious and made quantitative only with difficulty, hence Morgan's request for a better method.
I developed a new column method using borate complexing with the cis-hydroxyls to separate dinitrophenol derivatives of the amino sugars at pH 8. Because of the alkaline conditions needed for the complexing, the column had to be run in a cold room or else the coloured bands disappeared. The separation was better than on a paper chromatogram. To stand by a chromatogram in a cold room, at around about 0°C, for a few hours to collect the bands was very uncomfortable. Martin and I met in the laboratory workshop and he proceeded to invent for me an automatic fraction collector. Such things at that time did not exist.
We devised two or three simple mechanical systems operated by a siphon at the end of a centrally pivoted rotating balance arm so that, as the siphon filled to a constant volume, it dropped, operated a mechanical wire gate, and moved onto the next tube. The siphon then discharged, the arm lifted on to the other side of the gate and waited then for the subsequent filling of the siphon to trip it and move it on again. This work we published together [2].
Martin then moved to Mill Hill and invited me to join him as we got on so well. (Martin, I may say, was an absolute angel to work with, a brilliant man, the most brilliant I have ever come across, an extraordinarily kindly and helpful person, and I enjoyed enormously the number of years I spent with him.) At Mill Hill the task given to me was to try to put fractional crystallization on a column basis. We therefore devised a system of 4-mm columns packed with Celite, 4 feet long, along which was moved a temperature gradient cooled at one end with solid CO2 and heated at the other end with an electric coil. The mixture to be resolved was put at the end of the column and solvent was passed slowly along. We were, of course, attempting to invent zone refining. I worked on this for some months and was getting nowhere at all. The technique just would not work, presumably because of the very slow attainment of equilibrium in such a constantly filtered system. After three months’ work, the apparatus did less well than by use of crystallization in the normal way. I thus became somewhat depressed and this became rather obvious to Martin. Out of kindness to me, he suggested: “Why don’t we have a go at the gas chromatogram?” That cheered me up quite a bit because it was obvious that we were not going to get anywhere with the continuous fractional crystallization system.
We started with a 4-foot long, 4-mm internal diameter glass tube, packed with Celite, on which we put a liquid paraffin stationary phase. We chose, as model substances, to attempt to separate the volatile fatty acids. We did this simply because George Popjak, who had the laboratory next to us was working on the biosynthesis (in the rabbit mammary gland) of the short- and medium-chain fatty acids. The separation technique he normally used was the reversed-phase liquid chromatogram (also invented by A.J.P. Martin), involving the titration of many hundreds of fractions. Although the resolving power was high, it took an inordinate amount of time and nearly drove the assistant staff mad when they had to sit doing the multiple titrations day in and day out.
The short- and medium-chain fatty acids were volatile and they seemed to be good model substances. Martin, with his usual elegant simplicity, set up the column to run at room temperature because that should he adequate for the acetic, propionic and butyric acids, with nitrogen gas passed through as mobile phase. The end of the tube was drawn around so it passed into a test tube in which was placed an indicator in aqueous solution. We simply counted the number of drops from a conical flask containing 0.1N alkali - sufficient to maintain indicator colour. The number of drops was plotted against time, which gave the integral of the normal chromatographic peaks. Much to our surprise, we did not get any separation. In front of the zone was a beard and that continued through to higher concentrations when it immediately over-lapped with beard from the second component, and so on: very imperfect separation - no clear separation at all. We were totally baffled by this because the gas chromatogram was so obvious after the liquid chromatogram that it should have worked. At first we thought there must have been some very odd adsorption isotherms on the Celite, so we tried, in desperation, everything we could lay our hands on, even powdered coal. We also tried a capillary column – a simple glass tube with a liquid film on the inside – and, to speed up the rate of equilibration, arranged a helical spring inside, which was rotated through a gland to stir the film all the time. Still we found the same zone shape - a continuous overlap. This went on for something like two months and we didn't understand these negative results at all. Before finally giving up - perhaps there was something odd about the volatile fatty acids - we thought perhaps we’d try volatile bases - the methyl amines.
The titration results, plotting drop number against time to maintain neutrality (see Ref. 3), showed for the first time the integral of what looked like quite reasonable chromatographic peaks. This was the first really effective gas chromatogram (my code was column 29a, so I must have run at least 28 others beforehand). We thought we might still be getting slight absorption so we treated the Celite with alkali and improved the zone shape to that expected from a gas-liquid linear distribution isotherm.
That then gave us the first real way of showing that the gas chromatogram was perfectly feasible and that refined separation of very small amounts of material was achievable.
Now, of course, this was very laborious - you had to sit at the bench with the simple little drop titrator and with a watch. Martin used to have the watch. I used to have the drop titrator. But of course, if somebody came in to talk to you (which at Mill Hill was a pretty frequent occurrence), you turned round and lost the sequence, and the separation had to be repeated. We clearly needed a much simpler titrator, so Martin proceeded to devise a very elegant burette in which one rotated a handle fixed to a lead screw which forced a stainless-steel rod into the burette body itself through a simple polyethylene gland. By turning the handle a few times to get back to neutrality, one could read off the volume delivered on a linear scale. That was a great advantage; we could do many more experiments and study the separations more easily. Nevertheless, it was still laborious: you had to sit and watch the indicator solution continuously. The next stage was to make an automatic recording burette, and this we did.
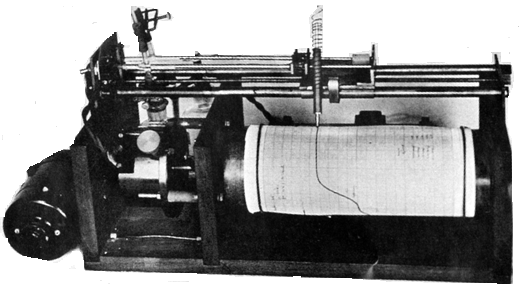
Figure 2 shows the electronically controlled microburette based on the earlier microburette. A ballpoint pen fixed to the lead screw plotted automatically on a drum, rotated by an electric clock movement, the volume of titrant delivered.
Figure 2. Automatic burette.
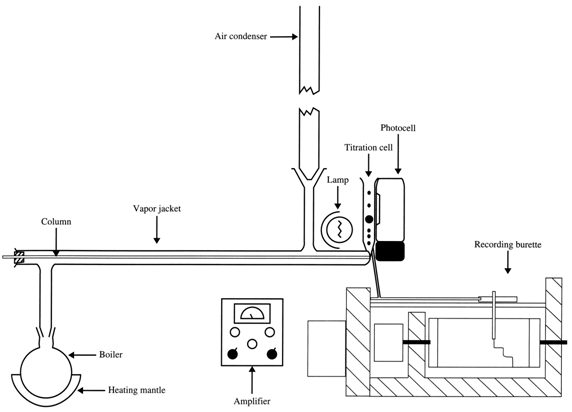
In Figure 3 is shown a schematic diagram of the whole apparatus. The column was held in a vapour jacket with a simple pressure seal at the junction with the titration cell.
Figure 3. Detection by titration.
With the vapour-jacketed system, we could vary the temperature of the column by changing the refluxing solvent. In those days one could not run along to a laboratory supplier and get electrically heated, thermostatically controlled devices - you either made them yourself or you did without. We used an air condenser so that we didn't have cold condensate dripping back on the column to give a cold spot. With this apparatus, we were able to study a wide range of volatile substances capable of being quantitatively detected by titration.
The device is now in the Science Museum on the first floor. I don’t recommend putting one's original apparatus in the Science Museum - it’s like erecting your tombstone!
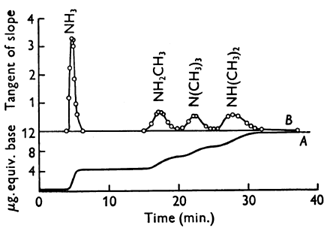
Figure 4 shows an example of a rapid separation of trimethylamine, dimethylamine, methylamine and ammonia, giving complete separation between zones.
Figure 4. First separation of ammonia and amines by gas chromatography [3] (reproduced by kind permission of the Biochemical Society).
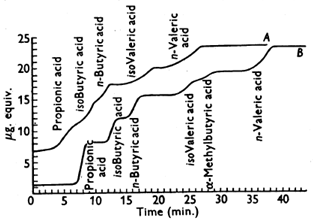
Figure 5 illustrates the effect we were getting with the fatty acids. In Curve A, the zones were bearded at the front with the high concentration part of the zone overlapped with the beard from the subsequent peak. We sat and discussed and argued over this for weeks as to why the fatty acids were behaving anomalously. Then the penny dropped - obvious now! Under the conditions we were using, the short-chain fatty acids were dimerizing at the high-concentration part of the zone so the partial pressure became proportional to the square of the concentration in the stationary phase. At the low-concentration part of the zone, the distribution coefficient was much more in favour of the moving phase. Low concentrations were travelling faster than the higher concentrations. The high concentration part of the zone had a sharp back. The obvious way to deal with this phenomenon was to add a long-chain fatty acid to the stationary phase, (which would not affect the titration cell). This swamped out the effect and allowed clear separation between the zones (Figure 5, Curve B). The paper describing the separation of the methylamines [3] was actually published after the fatty acid paper [4] and not in historical sequence.
Figure 5. First separation of propionic, iso-butyric, commercial iso-valeric and n-valeric acids [5]. A, column length, 4 ft; DC550 silicone; nitrogen pressure, 30 cm Hg; flow rate, 23 mL/min; column temp., 100°C. Incomplete resolution of all the acids. B, column length, 4 ft; stearic acid (10% w/w) in DC550 silicone; nitrogen pressure, 46 cm Hg; flow rate, 45 mL/min; column temp., 100°C. The iso-valeric acid band has been almost completely resolved into two components (reproduced by kind permission of the Biochemical Society).
This work demonstrated the refined separation now possible for volatile compounds. In the first paper, the theory of the gas-liquid chromatogram was developed covering the compressibility of the moving phase, and the theoretical plate concept was also covered.
However, the device we had constructed was limited to titratable substances. I described the technique at a Biochemical Society meeting at Mill Hill in October 1951. The first full paper was published in 1952 in the Biochemical Journal [5]. I went on to make an intensive study of chromatographic behaviour of a whole range of amines by comparing the relative retention volumes in two stationary phases - a non-polar one, liquid paraffin, and a polar one that could differentiate between amines of different types, e.g. primary, secondary and tertiary. For a time, this procedure of using different stationary phases was called the “poor man's mass spectrometer" because, by careful study of chromatographic behaviour of an unknown compound, one could get a great deal of indication of its structure [4].
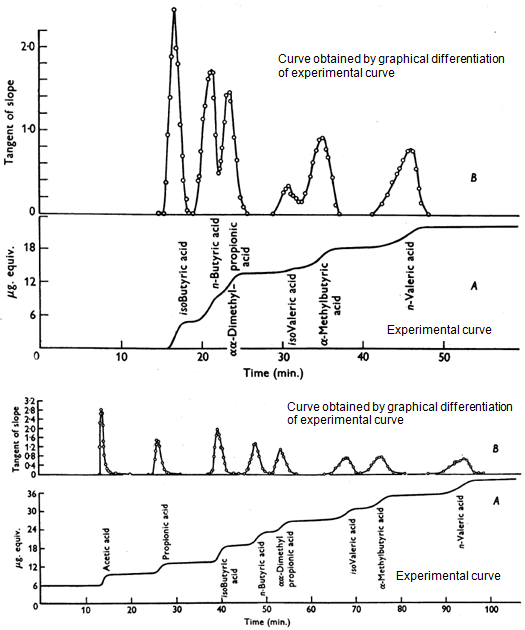
We now tried to get an even higher resolving power and constructed a column 11 feet long, which enabled us to separate the whole range of acids from C2 to C5, including isomers (Figure 6). In this diagram, the integral curves have been graphically differentiated to give more characteristic peaks. A comparison is made of the resolving power of 4- and 11-foot columns. Thus, the first papers had demonstrated the understanding of the solvent effects and how they could affect chromatographic behaviour. We showed that a series of simple chain compounds had a constant increment in retention volume for each additional CH2.
Figure 6. Top panel: The separation of the isomers of valeric acid showing incomplete resolution. Column length, 4 ft; flow rate, 43 mL/min; column temp., 100°C. Bottom panel: The separation of the isomers of valeric acid showing complete resolution. 11 ft; flow rate, 18.2 mL/min; column temp., 137°C; column efficiency, 2000 plates (reproduced by kind permission of the Biochemical Society).
Having developed a new separation technique that should be widely applicable, we were still limited by the nature of the gas detector. A general detector did exist, the catharometer, but Martin disliked the instrument because it was flow-sensitive and needed to be calibrated for every substance to give quantitative results. Nevertheless it was well known and was of quite reasonable sensitivity. We proceeded to construct a large column capable of handling grams of material. It was 20 feet long and an inch in diameter, which took me about two days to pack. We were able to separate five-gram quantities of the C5 and C6 aliphatic hydrocarbons very readily at room temperature, much more efficiently than could be done on the very best of total reflux fractionating columns. For this, Martin devised a different catharometer - one in which the flow was at right angles to the axis of the wire which made it inherently much less flow-sensitive.
The small experimental fluctuations in flow rate didn't affect the qualitative response, and it was a much less noisy device than the conventional catharometer. It was perfectly good for detecting the presence of a zone and for allowing us to collect it by cooling the gas stream in a trap at -30°C. We did not publish this, like much of our experimental work.
Martin became fascinated by the possibilities of condensing out zones onto a balance pan cooled to a low temperature because this would give a quantitative mass determination straightaway. Such a device however would require a microbalance of quite exceptionally high sensitivity and of a quality which had never been worked on or produced before. There was nothing one could buy of comparable sensitivity. Martin proceeded to design a single-pan quartz torsion balance. This meant using very thin quartz rods both for the arm and, after thinning, as thin torsion threads. Such manipulation was so touchy that one could do it only for about half an hour in the morning because one’s hands showed enough tremor to break the rods. The whole thing was so fragile, the beam being made of 0.5-mm quartz rod, that you only had to sneeze - as I did one day - and the whole thing shattered.
Nevertheless, Martin persisted with this, but I became more and more convinced that it was never actually going to be feasible. Therefore I got him to go back to a device he had thought of many years ago. Claesson, who had worked on gas-solid chromatography, had used a gas—density balance as detector. It consisted of a tubular device of an enormous dead volume. about 200 nm3 - enough to spread any zone - and a rather low sensitivity, but it did work. Martin went back and thought again for some weeks about his concept of a gas-density balance.
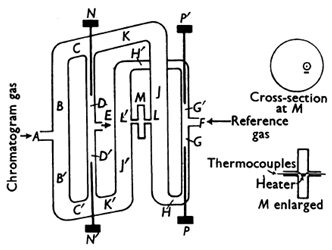
Figure 7 shows a schematic diagram of the gas-density balance. This was a beautiful and most elegant solution to a problem (typical of Martin). The gas-density balance was a three-dimensional set of channels giving two parallel moving columns of gas, one from a reference column with the same stationary phase, the same length and the same pressure drop, and the other from the chromatograph column. As soon as there was a density difference between the effluents from the columns due to the presence of a solute in the gas phase, this caused a movement of gas from one stream to another to restore equilibrium through the cross channel L’-L. This flow was detected very simply by a small electrically heated wire loop detector which gave a vertical steam of convected gas rising to a double thermocouple of copper-construction suspended above the loop and clamped into position. As soon as there was any gas flow, the hot convected stream was deflected, one thermocouple became hotter than the other and produced an electrical signal. This was amplified and fed to a recording galvanometer. This device could be calibrated absolutely in terms of the difference in molecular weights of solute and carrier gas. Furthermore, when adjusted correctly, it was flow-independent and more sensitive than the catharometer.
Figure 7. Schematic diagram of the gas density meter showing enlarged sections of the flow detector M [6] (reproduced by kind permission of the Biochemical Society).
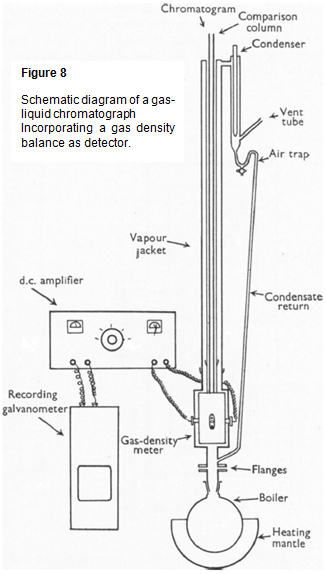 The gas-density balance was fitted inside the same vapour jacket as the columns and the whole arrangement is shown schematically in Figure 8 [6} (reproduced by kind permission of the Biochemical Society).
Martin's approach was to think up an idea, which he wished to resolve experimentally. He and I would discuss it for some days; at the end of about three or four days I would say; “Let's do the experiment,” to which the answer always was, “No, no, no - sit down and talk about it some more.” Over a period of perhaps two or three weeks we worked mentally through many, many experiments until in the end we did “the” experiment which defined it. The gas-density balance exemplified this approach of Martin's. He thought it through - the whole thing - again and again, until having spent many weeks thinking. he constructed a simple glass model. Now while I was quite a reasonable glass blower, Martin was an expert.
Whenever I made any apparatus, it worked, even if it looked as if it had been hewn out of wood - he would just take it over, and heat it in the flame and revolve it a few times, and then the joints looked perfect. The glass model was meant merely to demonstrate the principle, and the principle worked. The next device was a half-scale model constructed out of a block of brass. The third one finally was constructed out of a block of copper so that, with the high conductivity of the copper, no parasitic effects due to thermal differences in the gas streams would occur.
We then went on to show that this was now a general purpose detector that could detect any vapour in any gas stream and its response was easily calibrated for all substances. The paper [6] was a devil to write, especially the diagrams, since the device was bored from a three-dimensional block. Explaining this device to visitors when it was a visually impenetrable block of copper was somewhat difficult, so we made two or three transparent Perspex models which then travelled all over the place, particularly to industrial companies who became interested.
We now could expand out into a range of other substances.
While we were attempting the microbalance approach, we were visited by N.H. Ray of Imperial Chemical Industries (ICI Ltd) who had seen our early work. Martin suggested to him that he make an infrared detector as a very useful extension to existing detectors. Ray went back but used a catharometer and published a whole series of very good separations - in fact the first, I think, of alcohols and aliphatic halides. Martin and I now thought we would look at hydrocarbons because we were very interested in chromatographic behaviour and the rules governing it. Consequently we tried to separate the components of 40:60, 60:80 and 80:l00 petrol. We got a large number of peaks but could not identify them all. Now we know that during the war there was an enormous collaborative scheme among organic chemists from the United States and Britain, aimed at the synthesis of all isomeric hydrocarbons up to and beyond C12. We now discovered that this collection of pure hydrocarbons was reposing in British Petroleum (BP) hands. In order to relate chromatographic behaviour to paraffin hydrocarbon structure, we asked BP if we could have samples of all the C5 to C8 hydrocarbons. They wrote back very politely and inquired as to what we proposed to do with them. We replied by sending them our three separations, identifying some peaks and explaining that these were the first gas-chromatographic analyses of paraffin hydrocarbons. Two days later, the director of research of BP and Denis Desty arrived in our laboratory, and from then on BP never looked back. They soon scrapped their spinning band distillation columns and replaced them by gas-liquid chromatography under the leadership of Desty who developed this field extensively.
(As an interesting aside, the American who produced the world's best spinning band distillation columns, whom Martin knew, visited us in the early days of the gas chromatogram, when he virtually monopolized the world market in high-efficiency fractionating columns. He looked at the device and said: “Very ingenious, but it’s of no interest to me.” But seven years later, I don’t think he had a lot of business, the gas chromatogram having taken over so much from the fractionating column.)
Now that we had a whole set of compounds to work on, I studied extensively their chromatographic behaviour. We had already shown that addition of a methylene group to the backbone in fatty acids and amides give a constant increment in retention volume.
The same was now shown to be true for the hydrocarbons. even in branched chain and cyclic structures. This was published in 1956 [7], rather a long time after we completed the work, as usual. During all this time, we had been visited by many people - Roy Scott, the Unilever groups, Al Zlatkis and many others who went on to further develop the technique.
Martin had now decided to leave the National Institute and move into industry because he was interested in the development of improved instruments. I continued at the National Institute and concentrated on the long-chain fatty acids, their separation and quantitative estimation. I rapidly was able to show very highly refined separations that could pick up a whole series of fatty acids previously unknown to occur naturally. I then switched from gas chromatography to biochemistry, in particular the biochemistry of the fatty acids. By combining simple chemical additive and oxidative reactions, I was able to identify the position of double bonds in the molecule on a microscale [8].
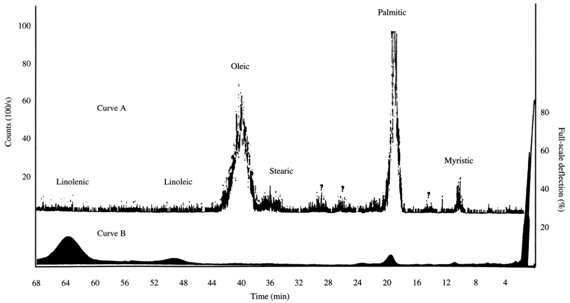
Biosynthesis pathways were, at that time, most easily studied by use of radiotracers (especially 14C), so Piper and I developed a radio gas chromatograph using a proportional counter as detector [9]. At one time, I had in the lab eight of these, which we built ourselves, since none was commercially available. Figure 9 shows the type of record attainable.
Figure 9. Typical result showing both records, (A) plot count rate and (B) Katharometer record.
I now began a series of collaborations, having worked on these methods of separating and identifying the structure of fatty acids on a microscale. One of my earliest collaborators was Jim Lovelock, also at the National Institute for Medical Research but in a different division. Lovelock persuaded me to make a study of the fatty acids in the lipids of the blood of patients with coronary artery disease, because there were many theories but little practical experimental fact. We did a study with some clinicians, and showed indeed that neutral lipids were elevated in those patients who had at least one infarction. However, we needed 5 mL of blood to separate out the neutral lipids from the plasma phospholipids. Lovelock suggested a much more sensitive detector based on ionization properties of the effluent gas from the column.
We rapidly evolved the first argon ionization detector, an order of magnitude greater in sensitivity than the gas-density balance. My major contribution was the central electrode, which was actually a tractor spark plug. Lovelock went on to develop even more highly sensitive ionization detectors of low dead volume, and this really opened up the field, especially for capillary gas-liquid chromatography developed by Golay. During the time from 1952 onward, the work was rapidly taken up elsewhere. Our very happy period, in which for the first three or four years we knew more about the subject than anybody else, rapidly disappeared but I was happy to devote myself to lipid biochemistry and subsequently biotechnology.
I must pay a tribute to A.J.P. Martin, Nobel laureate. This man, perhaps more than any other, changed the face of chemistry, analytical chemistry and biochemistry. His development of the liquid-liquid chromatogram, the reversed-phase chromatogram, the paper chromatogram and the gas-liquid chromatogram make him the finest genius that I have ever met. We owe him a great deal for his work.
References
- Martin, A.J.P. and Synge, R.L.M. A new form of chromatography employing two liquid phases. Biochem. J., 35, 1358-1368 (1941).
- James, A.T., Martin, A.J.P. and Randall, S.S. Automatic fraction collectors and a conductivity recorder. Ibid, 49, 293-299 (1951).
- James, A.T., Martin, A.J.P. and Smith, G.H. Gas-liquid partition chromatography: the separation and micro-estimation of ammonia and methyl amines. Ibid, 52, 238-242 (1952).
- James, A.T. Gas-liquid partition chromatography: the separation of volatile aliphatic amines and of the homologues of pyridine. Ibid, 52, 242-247 (1952).
- James, A.T. and Martin, A.J.P. Gas-liquid partition chromatography: the separation and micro-estimation of volatile fatty acids from formic acid to dodecanoic acid. Ibid, 50, 679-690 (1952).
- Martin, A.J.P. and James, A.T. Gas-liquid chromatography: the gas-density meter, a new approach for the detection of vapours in flowing gas streams. Ibid, 63, 138-143 (1956).
- James, A.T. and Martin, A.J.P. The separation and identification of some volatile paraffinic, napthenic, olefinic and aromatic hydrocarbons. J. Applied Chem., 6, 105-115 (1956) (DOI: 10.1002/jctb.5010060305).
- James, A.T. and Webb, J. Determination of the structure of unsaturated fatty acids on a micro scale with the gas-liquid chromatogram. Biochem. J., 66, 515-520 (1957).
- James, A.T. and Piper, E.A. Automatic recording of the radioactivity of zones eluted from the gas-liquid chromatogram. J. Chromatogr., 5, 265-271 (1961) (DOI: 10.1016/S0021-9673(01)92855-9).
Originally published by A.T. James in INFORM, 6, 820-834 (1995). We also have brief biographies of A.T. James, A.J.P. Martin and R.L.M. Synge. A more comprehensive biography of James has been published by the Royal Society (Gurr, M. Biogr. Mems. Fell. R. Soc., 58 129-150 (2012) (DOI:10.1098/rsbm.2011.0018").
