A Guide to the Practice of Quantitative Silver Ion TLC of Fatty Acids and Triacylglycerols
The Authors Boryana Nikolova-Damyanova and Svetlana Momchilova
1. Introduction
As with all chromatographic techniques in use, silver-ion thin-layer chromatography (Ag-TLC) faces the problem of providing quantitative results on the separated species. The ease and accuracy of quantification depend on the means of detection. As shown in previous web pages, because of the lack of chromophores in fatty acid (FA) and triacylglycerol (TAG) molecules, detection is performed by the use of spraying reagents which "stain" the component spots. The sensitivity of detection and the stability of the stain are crucial for the accuracy of the results. Three approaches for quantification have been described so far: the messy and time-consuming gravimetric approach, the time-consuming but reliable GC approach and the faster and reliable in situ quantification by the means of scanning densitometry.
Of these, the gravimetrical approach is of historical interest and will be only briefly described below. More attention will be paid to the use of scanning densitometry of fatty acids and triacylglycerols separated by Ag-TLC on both pre-coated and home-made plates. Indirect quantification by Ag-TLC and gas chromatography (GC) is also rarely used now but should be considered since it enables identification and correct quantification in one step, i.e. Ag-TLC separation of fatty acids and triacylglycerols with GC quantification of the fatty acid methyl esters in the presence of suitable internal standard. Details of the procedures can be found here...
Preparation of the samples and plates, impregnation with silver nitrate, detection, requirements towards the purity of sample, solvents and reagents are as described elsewhere in this Section (see Part A and Part B).
Attention should be paid to the smoothness of the layer and the quality of resolution of the components. The latter is limited by the height of the plate – 20 cm. This migration distance is sufficient for adequate resolution of mixtures of fatty acids with 0-6 double bonds and for simple mixtures of triacylglycerols (up to 10 components). The resolution of complex fatty acid and triacylglycerol mixtures may require 2 to 4 separate plates developed with mobile phases of increasing polarity. This case will be presented in detail further in the text.
Impregnation performed by dipping the plates in methanolic silver nitrate (see here - Section A) ensures sufficiently even distribution of silver ions over the plate.
2. Gravimetric Quantification
This approach can be applied to both fatty acids and triacylglycerols. It was previously used in fatty acid analysis when Ag-TLC was the single technique available to determine the trans-fatty acid content. We have used this approach intensively and successfully as an intermediate stage in the quantification of triacylglycerols in natural oils and fats by complementary application of Ag-TLC and reversed-phase TLC (RP-TLC) [1].
The methodology follows strictly the sequence of actions needed for purification of fatty acid/triacylglycerol species by preparative Ag-TLC - development, drying, spraying with nondestructive detection reagent, scraping the appropriate bands or spots, isolating the substance by mini silica gel columns in pre-weighed vials and weighing (analytical scale). Accurately weighed sample should be applied on the plate as evenly as possible in order to obtain clear and well-formed bands, which can be easily scraped from the plate. The major part of the detection reagent, being highly polar, remains in the column. Traces of this do not compromise the quantitative results to a measurable extent.
Our experience with gravimetric quantification by preparative Ag-TLC is limited to home-made plates. The few attempts to use pre-coated plates for the purpose failed. Because of manufacturing procedures, and the resulting quality and composition of the layer, there is no reasonable way to impregnate the coating with silver ions. The plates need to be immersed in methanolic silver nitrate for too long, which results in layer darkening. In addition, development is slow and impractical, and the bands are not easily scraped off.
Although the gravimetric quantification is laborious and time consuming, it provides correctly the quantitative distribution between the components in values comparable to those obtained by some of the recent sophisticated chromatographic techniques. Note: The small amounts of impurities like silica, binders, silver ions and spraying reagents as compared to the large sample load impact the results in the range of the statistical error only, which does not exceed 10% relative.
3. Scanning Densitometry
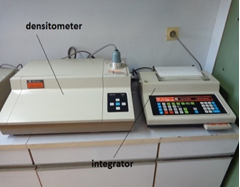
Scanning densitometry is the method of choice for in situ quantification of fatty acids and triacylglycerols when the equipment is available, thus minimizing the number of operations and decreasing the sources of error. The laboratory instruments, known as densitometers, are spectrophotometers utilized in measuring the differences in light absorption or reflection of a chromatographic plate by means of a beam of monochromatic light which scans systematically the track of a chromatogram. The beam is usually in the form of a spot or a slit of a selectable size, and most modern instruments offer monochromatic light in a broad range between 190 and 900 nm. The instruments are able to provide the full absorption spectra of a spot/band thus helping to identify a component. It is possible to calibrate the measurements thus ensuring substantial accuracy of the quantitative results. Information on the instrumentation is available at the following web sites - Camag and Chemotron. Since no information was found on Shimadzu scanning densitometers (except in sites for second-hand instrumentation), which were widely used some 10 years ago, it seems that the company stopped producing and supporting these rather good instruments. Our experience and the following comments are limited to the use of a Shimadzu CS–930 scanner equipped with a Shimadzu DR–2 electronic integrator, which we have found very reliable. The densitometer scans chromatograms on plates with dimensions up to 20 × 20 cm in both transmission and reflectance zigzag modes (Fig. 1). A modern alternative is for an imaging system such as the GE molecular dynamics imager, the Syngene Chromascan or the ChromaDoc-It™ TLC Imaging System.
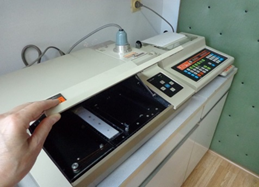
Figure 1. Shimadzu CS-930 and DR-2 integrator, general view (left) and plate position (right).
The results are expressed in normalized area per cent, as derived from the integrator (or any computer software since all are employing the same basic principles).
It is evident from the above that components subjected to quantitative TLC should either have the same chromophores absorbing at a given wavelength or to be equally coloured by means of a staining reagent. Only the latter approach is applicable to lipids and in almost all procedures, simple charring under controlled conditions was found to be the easiest and best solution. No interference of silver ions on the measurements has been detected.
Some important requirements should be met with no exception in order to perform correct quantitative analysis. The most important are listed below:
-
Quantitative Ag-TLC is the final stage of analytical Ag-TLC. Note: This means that all requirements toward the layer quality, sample load, and development should follow the procedure described here…(Part B). Both silica gel 60 pre-coated plates and best quality home-made analytical silica gel G plates (layer thickness up to ca. 200 µm) are suitable for densitometric quantification. We have used successfully 5 × 20 cm pre-coated Silica gel 60 glass plates only for the quantification of fatty acid methyl esters. Attempts to use them for separation and quantification of triacylglycerols failed and further examples were performed on home-made plates. Note: Due to the hazardous charring procedure only glass-backed pre-coated plates are to be used.
-
Impregnation is performed with 0.5% to 2.0% methanolic solution of silver nitrate (depending on the level of FA or TAG unsaturation) as described and illustrated here…(Part B). Note: The pre-coated plates required immersion in the solution for 5 min. The low silver ion load appeared highly advantageous for quantitative Ag-TLC in comparison to the usually used 10% and more. The plates do not darken, the resolution improves, and fine differences in interaction between double bonds and silver ions are clearly exposed. See [2] for more details.
-
Sample load is of importance and measures should be taken to avoid overload. As with all spectrophotometric techniques, sample overload leads to incorrect quantification. Experiments with the Shimadzu CS–930 have shown that signal/concentration relationship is linear in the range 0.2 - 10 µg substance per spot in transmission and 5 - 20 µg per spot in reflection mode [3]. Note: If one is going to use quantitative Ag-TLC it is worth determining once and for all the linear range signal/concentration for the respective instrumentation and work protocol. Since natural samples contain components in a rather broad range of quantities we advise to use different plates and different loads in order to quantify correctly all components – from major ones to traces as shown on Figure 2, using one or two of the moderate components as internal standards.
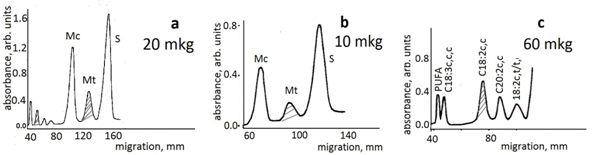
Figure 2. Quantitative Ag-TLC on 5 × 20 cm home-made plates of fatty acid methyl esters in a butter fat sample. Plates are impregnated with 0.5% silver nitrate. Components are visualized by consecutive treatment with bromine and sulfuryl chloride vapours followed by heating at 180-200°C. Scanning was performed by a Shimadzu CS–930 densitometer in zigzag reflectance mode at 450 nm, beam-slit 1.2 mm × 1.2 mm, stage step 0.2 mm. S and M denote saturated and monoenoic fatty acids, c- cis and t- trans isomers, PUFA, polyunsaturated fatty acids. The peaks of the components used as internal standards are marked. Results are recalculated as relative area per cent.
As shown, three different sample loads were applied on three different plates, which were developed separately according to the protocol, visualized and subjected to scanning densitometry. The sample load size is estimated depending on the number of components and their quantity distribution on the basis of analytical Ag-TLC. In the example shown in Figure 2, a load size of 20 mkg shows clearly all components and allows correct determination of the area of the components Mt and C18:2c,c, chosen as internal standards. Correct measurements of S and Mc areas require a lower load, and that of the minor dienoic and trienoic fatty acids - a much higher one. An exact procedure of how to determine the sample load cannot be offered; one has to estimate it on the basis of analytical Ag-TLC aimed to present the general picture of the sample composition and identify the component.
-
Chromatographic development faces the difficult task of separating clearly all components in a distance of 20 cm. This migration distance is more than enough for simple fatty acid and triacylglycerol mixtures (fatty acids with 0 to 6 double bonds and triacylglycerol species with 0 to 9 double bonds). Since a gradient elution of triacylglycerols, for example, on a single plate is impossible, the problem is avoided by applying different sample loads on different plates, and choosing different mobile phases best suitable for clear resolution of a given group of fatty acids or triacylglycerols as is demonstrated by Figure 3.
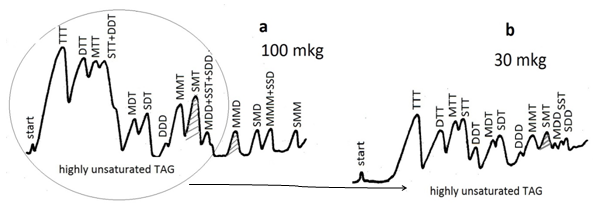
Figure 3. Densitometric quantification of triacylglycerols from linseed oil separated by silver ion TLC. Plates are impregnated with 0.5% silver nitrate. Spots are visualized by consecutive treatment with bromine and sulfuryl chloride vapours for 30 min each followed by heating at 180-200°C; (a) sample size 100 mkg, mobile phase: 6 mL hexane-acetone, 100:5 (v/v); (b) sample size 30-35 mkg, mobile phase: 10 mL hexane-acetone, 100:12 (v/v); development in open cylindrical tanks. Measurements with Shimadzu CS-930 densitometer in zigzag reflectance mode at 450 nm, beam-slit 1.2 mm × 1.2 mm. S, M, D and T denote saturated, monoenoic, dienoic and trienoic fatty acyl residues, respectively.
Development in open cylindrical tanks as demonstrated here…(Part B) allows use of larger mobile phase volumes of suitable polarity. Note: about 3-4 mL solvent is sufficient for a single development of a 5 × 20 cm plate in a closed cylindrical tank, 10-12 mLcould be allowed to pass through the plate of the same dimension if the tank is left uncovered. Allowing the whole solvent volume to pass through the plate improves the resolution substantially when compared to single or even multiple development in a closed or large chamber. In addition, this development technique results in almost straight chromatographic tracks suitable for scanning densitometry as is evident from authentic plates and densitograms shown below. Note: To prevent darkening of the plate in direct sunlight we put the tank(s) in a cupboard (Fig. 4) in a special well-ventilated space.
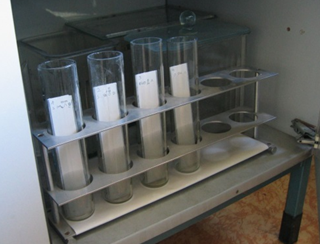
Figure 4. Development of Ag-TLC plates for densitometric quantification of the samples.
-
Detection by charring is in our experience the most suitable approach to detect and quantify the separated fatty acid and triacylglycerol components. Although spraying with a charring reagent such as ethanolic sulfuric acid is widely used (for example, see here…(Part B)), we developed a different procedure using vapours of charring reagents for the purpose. Thus, after development, the plates are dried (for 1 h at 110°C), and treated consecutively with bromine and sulfuryl chloride vapours (30 min each, in closed tanks and in a fume-cupboard) to ensure the correct quantitative charring (at 180-200°C on a temperature-controlled hot plate) of the separated fatty acids or triacylglycerol classes. This treatment ensures good contrast between the almost white background and evenly black-stained component spots/zones. Bromine is believed to react with Ag+ to give pale-coloured AgBr and prevent the darkening of the plate when heated. The 30 min successive treatment with sulfuryl chloride vapours ensures complete carbonization of the components, including all-saturated fatty acids and triacylglycerols in amounts related to the quantity in the sample.
-
Densitometric measurements. Once a plate has been treated to visualize the separated components (Fig. 5), it is placed in the scanning compartment of the densitometer and scanned in zigzag mode at 450 nm with a slit of dimensions depending on the size and shape of the spots. We use usually 0.4 mm × 0.4 mm or 1.2 mm × 1.2 mm with a stage step of 0.2 mm. Note: The standard deviation between repeated determinations of the same sample (always starting the procedure from the very beginning) does not exceed 9%. Note: Accuracy of triacylglycerols quantification should be confirmed by comparing the fatty acid composition calculated from the densitometric results of components with that determined by GC.
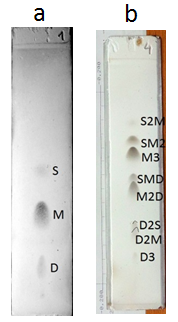 Figure 5. Quantitative Ag-TLC. Plates ready for densitometric scan; (a) fatty acid methyl esters in hazelnut oil; (b) triacylglycerols in hazelnut oil (abbreviations as in Figs. 2 and 3). Impregnation with 0.5% methanolic silver nitrate; plates are treated successively with bromine and sulfuryl chloride vapours for 30 min each followed by heating at 180-200°C.
-
Examples of densitograms
A. On home-made plates
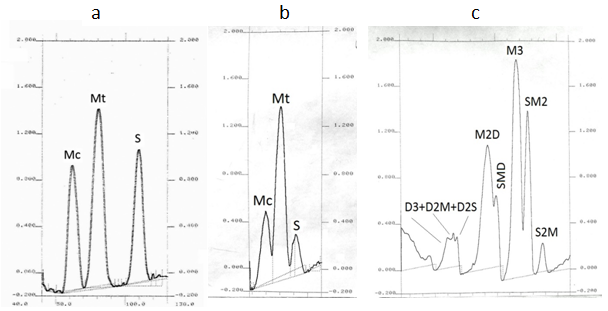
Figure 6. Authentic densitograms of fatty acid methyl esters and triacylglycerols determined by quantitative Ag-TLC; (a) standard mixture of fatty acids; (b) fatty acids in partially hydrogenated sunflower oil; (c) triacylglycerols in hazelnut oil (abbreviations as in Figs. 2 and 3). Plates were impregnated with 0.5% methanolic silver nitrate and treated with bromine and sulfuryl chloride vapours. Scanning with Shimadzu CS–930 densitometer in zigzag reflectance mode at 450 nm, beam-slit 1.2 mm × 1.2 mm.
B. On precoated plates
We have experience with quantitative Ag-TLC on only using 5 cm × 20 cm Silica gel 60 precoated plates, treated as described here…(Part B) for the quantification of reference mixture of fatty acids with 0 to 6 double bonds. An example is shown in Figure 7.
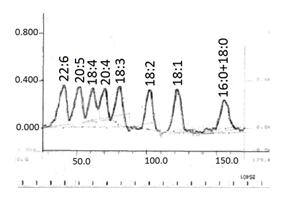
Figure 7. Densitogram of quantitative Ag-TLC of reference mixture of fatty acid methyl esters with 0 to 6 double bonds. Plate was impregnated with 0.5% silver nitrate, developed in an open cylindrical tank with 10 mL mobile phase of chloroform-methanol-formic acid, 100:0.4:1.5 (v/v/v) and treated with bromine and sulfuryl chloride vapours; scanning with Shimadzu CS–930 densitometer in zigzag reflectance mode at 450 nm, beam-slit 1.2 mm × 1.2 mm.
Conclusion
In recent years, TLC both as a separation technique and as an approach for quantification of the separated compounds has lost much of the significance it had previously. However, there are still industries and research laboratories that appreciate the simplicity of instrumentation and the bench skills to provide accurate quantitative results on the composition of even complicated mixtures of components. A recent book [4] discusses the role and advantages of quantitative TLC. Ag-TLC is also an invaluable adjunct for the identification of minor fatty acid components. In the analysis of triacylglycerols, much more information can be obtained when quantitative Ag-TLC is performed as first stage in the analysis followed by preparative Ag-TLC and quantitative reversed-phase TLC (RP-TLC). The approach is indeed slower, but is able to provide results on composition and quantities with a trustworthiness and accuracy comparable to that obtained by much more expensive mass spectrometry techniques.
References
- Nikolova-Damyanova, B. Quantitative thin-layer chromatography of triacylglycerols: principles and applications, A review. J. Liq. Chromatogr. Relat. Technol., 22, 1513-1537 (1999).
- Nikolova-Damyanova, B. Retention of lipids in silver ion high-performance liquid chromatography: Facts and assumptions. J. Chromatogr. A, 1216, 1815-1824 (2009) (DOI: 10.1016/j.chroma.2008.10.097).
- Nikolova-Damyanova, B. and Amidzhin, B. Densitometric quantification of triacylglycerols. J. Planar Chromatogr.-Modern TLC, 4, 397-401 (1991).
- Spangenberg, B., Poole, C.F. and Weins, Ch. Quantitative Thin-Layer Chromatography: A Practical Survey (Springer Verlag, Berlin, Heidelberg) (2011).
Updated: February 6th, 2014
In This Section
- Principles of Silver Ion Complexation with Double Bonds
- Silver Ion Chromatography and Lipids, Part 2
- Silver Ion Chromatography and Lipids, Part 3
- Silver Ion Chromatography and Lipids, Part 4
- Silver Ion Chromatography of Lipids References
- Introduction to Silver Ion Chromatography
- Mechanism of Retention of Unsaturated Lipids
- Retention Order of Fatty Acids and Triacylglycerols
- Multiple Interactions in Silver Ion Chromatography of Lipids
- How to Make a Column for Silver Ion HPLC
- Solid-Phase Extraction Chromatography in the Silver Ion Mode
- Preparative Silver Ion Chromatography on Home-Made TLC plates
- A Guide to the Practice of Analytical Silver Ion-thin-layer chromatography on Pre-coated Silica Gel Plates
- A Guide to the Practice of Quantitative Silver Ion TLC of Fatty Acids and Triacylglycerols
- Silver ion TLC with Quantification by a Gas Chromatography Method