Preparative Silver Ion Chromatography on Home-Made TLC plates
The Authors: Boryana Nikolova-Damyanova and Svetlana Momchilova, Institute of Organic Chemistry, Centre of Phytochemistry, Bulgarian Academy of Sciences, Sofia 1113, Bulgaria
1. Introduction
The role of silver ion chromatography in lipid analysis is not always appreciated. The single separation principle on which it is based simplifies analysis, and when it is combined with reversed phase chromatography and modern detection systems, silver ion chromatography can ensure the correctness and credibility of the final results. The technique can be messy, time-consuming, and, worst of all in some eyes, it is not computerized. The practice of silver ion thin-layer chromatography (Ag-TLC) requires some basic bench-skills – one has to work more with one’s hands and brain than leaving the task to machine and software. On the other hand, Ag-TLC is inexpensive, easy to perform, versatile and provides invaluable basic qualitative information about the composition of major lipid classes such as fatty acids (FA) and triacylglycerols (TAG). Simple equipment only is required: plates (home-made or commercial), silica gel G for TLC (for home-made plates), silver nitrate of p.a. purity, suitable glass vessels for chromatography, solvents, common spray reagents, a hot plate or UV-lamp and common laboratory glassware.
If the task is to collect preliminary information on the FA and TAG composition of an unknown sample, the simple solution is to use analytical Ag-TLC. The information will help to design further Ag-HPLC analyses and aid the interpretation of other chromatographic data. Preparative Ag-TLC is especially helpful for the isolation of sufficient amounts of chromatographically pure natural FA or mixed acid TAG to serve as chromatographic standards when these are not commercially available or are very expensive.
The theory, achievements and role of Ag-TLC in developing lipid analysis are discussed in a review on this site. Here, a brief guide in text and pictures is presented to summarize our experience with the technique, with the aim of showing that one can get reliable and informative results by using simple equipment. All the illustrations are taken from routine practice in our laboratory where we use Ag-TLC as a preliminary step prior to Ag-HPLC, RP-HPLC and GC-MS, but also to perform detailed analysis of the FA and TAG compositions of complex natural lipid samples and to produce our own chromatographically pure standards. Additional comments on the procedures described here can be found in some review papers [1-4].
For chemicals, solvents and equipment required to perform TLC – from plates and sorbents to TLC-MS interface - see CAMAG, ANALTECH, SIGMA-ALDRICH, COLE-PARMER and MERCK Group, for example.
2. Sample preparation – preliminary step
The procedures for sample preparation depend on the lipid class to be examined, and detailed protocols for isolation of total lipids and their conversion in FA derivatives can be found in [5]. The isolation of TAG and the purification of the fatty acid derivatives could be performed by solid-phase extraction or by preparative silica gel TLC. For the latter, we use TLC on home-made 20 × 20 cm glass plates covered with silica gel G layer (ca. 0.5 – 1.0 mm thick) and a mobile phase of hexane-acetone, 100:X (by volume, where X may vary between 3 to 10 volume parts depending on the polarity of the lipid sample, the Rf value of the component of interest, and the temperature and humidity in the laboratory). A simple preliminary test with analytical TLC (see Fig. 1) helps to design the preparative separation.
Figure 1. Separation of lipids classes (walnut kernel oil) by preparative silica gel G TLC, 20 × 20 cm home-made preparative glass plate; sample size is ca. 80 mg, spraying reagent: 2,7-dichlorofluorescein (0.1% ethanolic solution) and UV detection at 366 nm (right); analytical TLC (left) (StE, sterol esters, TAG, triacylglycerols, X, unknown, St, sterols, DAG, diacylglycerols, MAG, monoacylglycerols, FFA, free fatty acids).

Samples are dissolved in an appropriate volume of hexane to give 5-20% solutions. Loads vary from 10 mg to 200 mg per plate depending on the purpose. Note: Samples with a high number of closely related components (four or more) or with one or two dominating components are resolved better at lower sample load.
Components are recovered as described below in pre-weighed brown glass vessels with tight stoppers, evaporated to dryness and redissolved in hexane to give sample solutions of known concentration.
3. Preparation of Ag-TLC plates
Any rectangular piece of glass, with thickness of ca. 3 mm, cut in 20 × 20 cm sheets and thoroughly cleaned (no acids, simple washing liquid, rinsing with generous amount of water) and dried are suitable. Edges should be smoothed, and one (better both) of the surfaces should be roughened with abrasive powder in order to hold the silica gel layer more strongly.
Clean dry plates are coated with silica gel G slurry (47 g silica gel G 60 powder for TLC mixed under energetic stirring, with particle sizes ranging from 5-40 µm in 100 mL water, add silica gel to water) to give (most often) ca. 1.0 mm thick layer for 5 plates at a time. A layer with a thickness of 1.0 mm has in most cases enough capacity for sample loads of 100-200 mg. At present, hand-operated (similar to the one shown in Fig. 2A) and automatic coaters are commercially available. The plates are then left to dry on a rack for 24 hours (Fig. 2B) in a sheltered place in the laboratory in order to keep the layer surface as clean as possible.
A B Figure 2. Preparation of preparative plates. A, the spreader and plates to be coated with silica gel G; B, the rack with plates to dry.


Different procedures to incorporate Ag+ in the layer have been reported: adding a silver salt in the silica gel slurry; immersing the coated plate in silver salt solution; spraying the layer with silver salt solution. Of these the immersing procedure is most often used and was adopted in our laboratory. Also, different silver salts have been proposed as sources of Ag+ but silver nitrate is, for many reasons, the best choice. The amount of Ag+ has been also a subject of discussion. Layers containing as much as 20 to 30% were once considered necessary for good separation. Later, it was found and confirmed repeatedly that a high AgNO3 content in the plate does not improve retention or selectivity and causes problems with rapid darkening of the surface, troublesome detection of components and transference of appreciable amounts of silver ions into the subsequent analytical steps. For many years we have demonstrated that these high amounts are not required, and 0.5 to 2% methanolic AgNO3 ensures excellent resolution. The plates do not darken easily in the light (the colour is pale yellow) and it is possible to keep them in a cupboard, for example, for several days with no effect on the selectivity of separation. Thus, we recommend impregnation by immersing the plate in the silver nitrate solution in a glass vessel (any vessel of inert transparent material will do, in Figure 3A a commercial chromatographic tank is shown) for several seconds. There is no need to fill the vessel more than to the half. You may turn the plate and immerse the untreated part. The final result is shown in Figure 3B. Note: substantial quantities of pure FA and TAG components can be obtained by impregnating the plate with 0.5-2% methanolic AgNO3 only.
A B Figure 3. Impregnation of preparative plates. A, immersing a plate in the methanolic AgNO3 (commercial chromatographic tank); B, impregnated plate.


Commercial preparative plates precoated with silica gel are also available from many manufacturers. These are offered in varieties of layer thicknesses, with or without a “concentration zone”. We have no experience with commercial preparative plates thus, these will be not discussed further. Note: Purchase plates precoated with plain silica gel 60 and keep in mind that introducing silver ions into the layer requires special and longer treatment.
4. Sample application
Although automatic sample applicators are available, the sample (hexane solution) is easily applied by using a Pasteur pipette (Fig. 4). Small scratches on the surface do not matter and with a little practice, a straight and even band at 1.5-2.0 cm from the bottom edge of the plate can be applied.
|
Figure 4. Sample application with Pasteur pipette. |
 |
5. Development
After the application of the sample, the solvent is left to evaporate for a short time until the plate is ready to be developed in a chromatography tank. For the purpose of preparative TLC it is advisable to purchase commercial vessels similar to that shown in Figure 5A. It is possible to develop more than one plate if a suitable tank is selected. Some commercial tanks, including that in Figure 5A, are designed to permit simultaneous development of up to 5-6 plates. Note: The volume of mobile phase should be carefully calculated and the resolution is not identical for all plates. Our observations show that plates placed in the middle provide the best resolution.
A B Figure 5. Development of preparative plates to separate walnut TAG after preliminary isolation by preparative silica gel TLC. A, chromatography tank; B, freshly developed plate.


A freshly prepared and very well mixed mobile phase is firstly poured in the tank. Depending on the total number of plates in the tank, the following mobile phase volumes are usually enough for a single development: 50 mLfor 1 plate, 60 mL for 2 plates, 75 mL for 3 plates, 100 mL for 4 plates, 120 mL for 5 plates, 150 mL for 6 plates. The plate is then placed in the tank, and this is covered as shown in Figure 5A. Note: No preliminary saturation is required. Avoid it. Take care to ensure that the sample application band is above the surface of the solvent in the tank.
The mobile phases usually consist of two or three components. The main component is normally of low or moderate polarity and hexane, petroleum ether (a mix of hydrocarbons with b.p. 40-60°C), or in a few special cases chloroform, benzene or toluene can be used, although the latter are best avoided for health reasons. Methanol, acetone, rarely ethanol are suitable modifiers. We use most often hexane-acetone in different proportions.
In most cases, a single development to a solvent front of ca. 17-18 cm ensures a very good separation. With multicomponent samples (some TAG samples, for example), several successive developments with mobile phases of increasing polarity may help. For the purpose, after each run the plate is taken out of the tank (see Fig. 5B), dried thoroughly and developed again. Examples can be found here. After the development we leave the plates to dry in air for about 1 hour. Blowing with a very gentle stream of nitrogen or better with cold air (hairdryer) for several minutes will speed the procedure without causing any harm.
The plates are normally developed at ambient temperature, usually at 22-25°C. Small variations do not affect the resolution. When the temperature increases or decreases outside this range, the mobile phase polarity should be decreased or increased as appropriate. The versatility of Ag-TLC is demonstrated by the fact that one can easily adjust the mobile phase composition to the ambient temperature without losing resolution.
6. Sample recovery
This is an important step which should be performed carefully. Firstly, the components on the plate must be detected. As seen above (Fig. 5B) the layer surface rarely shows any signs of chromatographic bands. Lipids have no chromophores and direct UV detection is not possible. Since the separated component(s) have to be recovered from the plate for further analysis, detection is carried out by spraying the plate with a moderate amount of a non-destructive fluorescent reagent – 2,7-dichlorofluorescein (usually 0.05-0.1% ethanolic solution) using a simple commercial sprayer (Fig. 6A). The sprayer produces a fine mist of the reagent covering the surface as evenly as possible as shown in Figure 6B. Next, the plate is viewed under UV light – 366 nm (Fig. 6C).

A

B

C

D

EFigure 6. Sample recovery by spraying with 2,7-dichlorofluorescein (0.05% in ethanol). A, the sprayer; B, the freshly sprayed plate; C, viewing (UV at 366 nm) and marking FAME bands of partially hydrogenated sunflower oil; D, scraping; E. Recovery of FAME components separated by preparative Ag-TLC after scraping and transferring the sorbent + component to small columns and deluting with 5 mL diethyl ether.
UV cabinets are commercially available and a variety of models is offered. The critical point here is to carefully mark the boundaries of the band/s of interest (Fig. 6C) with some sharp implement (inert material) and then scrape the sorbent onto a clean and glossy sheet of paper or of any inert material (Fig. 6D) that will allow easy transfer of the material for further treatment to isolate the component (all tools needed to perform this operation are commercially available). The powder is carefully transferred (small funnel) to small glass columns (thoroughly prewashed cotton piece at the bottom, Fig. 6E). Finally, the lipid is eluted as shown with a sufficient volume of solvent (we use diethyl ether for FA and TAG).
7. Identification and purity check
The main tasks for preparative Ag-TLC are isolation of chromatographically pure FA (mostly configurationally isomeric, cis- and trans-FA) and TAG of different structure and unsaturation for either further examination or as standards. The final result therefore is estimated by checking the purity of the isolated components. In Figure 7A, the purity (and identity) check of monounsaturated (M) fatty acid methyl esters (FAME) on home-made analytical plates is shown. Trans (Mt) - and cis (Mc) components are clearly identified (a standard mixture of FAME is applied in the middle of the plate, S indicates saturated FAME) and there are no traces of impurities. This indicates that the preparative procedure on home-made Ag-TLC plate was successful. Both Mc and Mt species (isolated from partially hydrogenated sunflower oil sample) were further converted into suitable derivatives and subjected to gas chromatography-mass spectrometry to elucidate the structure of each component. We normally use purified Mt and Mc FAME fractions as standards and the respective mass spectra as a database for further analysis.
A1
A2
B
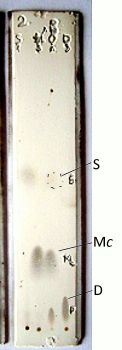
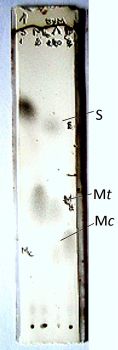
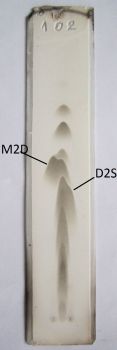
Figure. 7. Purity and identity checks on analytical Ag-TLC plates. A1, walnut oil FAME, sample load 60 µg single development with hexane-acetone, 100:2 (v/v), commercial FAME standard mixture; A2 partially hydrogenated sunflower oil FAME, sample load 60 µg, mobile phase 100:2.5 (v/v ) commercial FAME standard mixture; B, M2D and D2S walnut oil TAG vs. total walnut TAG mixture, sample load 125 µg, mobile phase hexane-acetone-ethanol, 100:4:1 (v/v/v).; detection by spraying with 50% H2SO4 in ethanol, heating at 200°C (hot plate) (S, saturated; M, monounsaturated; D, diunsaturated fatty acyl moieties).
Analysis of the purity of individual TAG classes isolated from walnut oil is illustrated in Figure 7B (S, M and D indicate saturated, monounsaturated and diunsaturated acyl moieties, respectively) compared to the total walnut TAG. Walnut TAG were identified by co-chromatographing with a standard mixture of TAG prepared in the laboratory by admixing pure TAG fractions from lard and sunflower oil in 1:1 proportion. The standard lard and sunflower oil TAG were isolated by preparative silica gel TLC as shown above. Note: The tested lipid component form a joint chromatographic zone only with the matching FAME or TAG from the standard mixture. Even in case of heavy overload of either the sample or the standard (which strongly affects the migration distance of a zone) it is possible to unambiguously identify the components.
In confirmation, the RP-HPLC chromatograms of the DM2 and D2S TAG are presented in Figures 8A and 8B, respectively, demonstrating convincingly the purity of the TAG isolated by preparative Ag-TLC under the conditions described above.
Figure 8. RP-HPLC chromatogram of DM2 (A) and D2S (B) TAG classes (walnut oil TAG), Agilent Series 1100 chromatograph equipped with Inertsil 5 ODS-2 Chrom Sep SS 250 × 4.6 mm column (Varian, Inc., USA) and PL-ELS 1000 light-scattering detector (Polymer Laboratories Inc.), sample size of 40 µg, mobile phases А: acetonitrile - 2-propanol, 9:1 (v/v) and B: dichloromethane; linear gradient from 10 to 40 % B in A for 30 min at 1 mL/min flow rate (O, oleic; L, linoleic; P, palmitic; S, stearic acid residues).

References
- Morris, L.J. Separation of lipids by silver ion chromatography. J. Lipid Res., 7, 717-732 (1966) (Download PDF file (17 Mb).
- Nikolova-Damyanova, B. and Momchilova, Sv. Silver ion chromatography of fatty acids. A survey. J. Liq. Chromatogr. Relat. Technol., 24, 1447-1466 (2001).
- Momchilova, S. and Nikolova-Damyanova, B. Stationary phases for silver ion chromatography of lipids: Preparation and properties. J. Sep. Sci., 26, 261-270 (2003).
- Nikolova-Damyanova, B. Lipid analysis by silver ion chromatography. In: Advances in Lipid Methodology - Five. pp. 43-123 (ed. R.O. Adlof, Oily Press, Bridgwater and Woodhead Publishing Ltd) (2003).
- Christie, W.W. and Han, X. Lipid Analysis - Isolation, Separation, Identification and Lipidomic Analysis (4th edition), 446 pages (Oily Press, Bridgwater, U.K. and Woodhead Publishing Ltd, Cambridge, U.K.) (2010) - Woodhead Publishing Ltd.